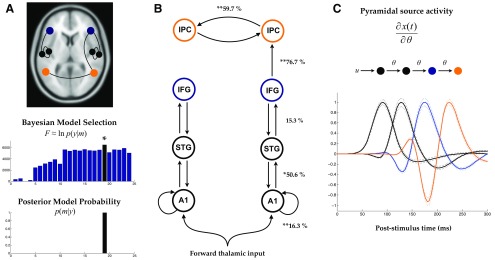
Figure 4.
A, Anatomical architecture of the DCM that best explains the brain responses to changes from midline to the left side of auditory space. This right-lateralized network has the highest log-evidence and a posterior model probability > 0.99. B, Network graph showing percentage changes in effective connectivity that increases selectively in the hemisphere contralateral to sensory stimulation (*p < 0.05, **p < 0.05 Bonferroni corrected). C, Average response of temporal, frontal, and parietal sources in the right hemisphere with respect to a change in its forward connection ∂x(t)/∂θ.

