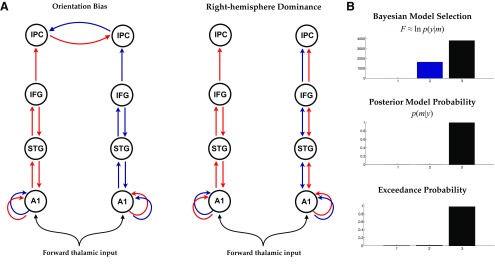
Figure 6.
A, Network graph of the orientation bias model and the right-hemisphere dominance model: right (red) and left (blue) side of stimulus space. B, Bayesian model selection showing the (relative) log-evidences of (1) a null model with no change in coupling, (2) the orientation bias model with a contralateral change in coupling, and (3) the right-hemisphere dominance model. A posterior model probability > 0.99 and exceedance probability of > 0.98 is strong evidence in favor of a hemispheric asymmetry.

