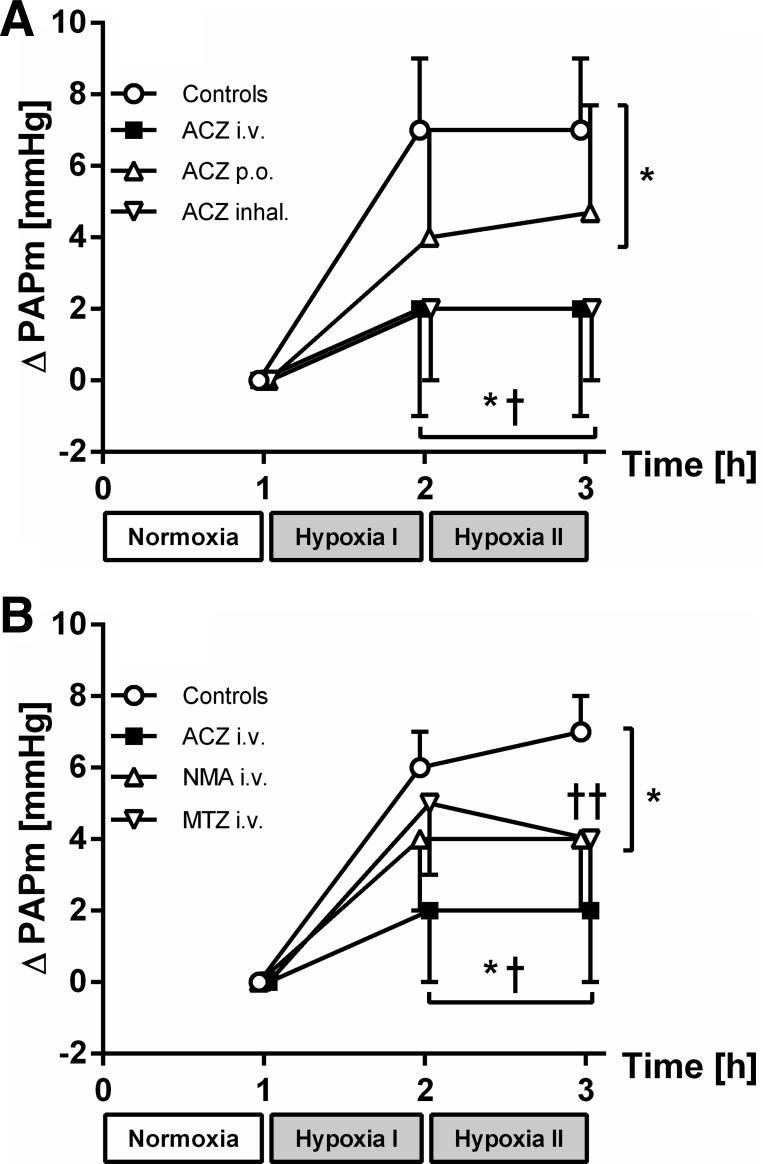
Fig. 2.
A: change (Δ) in mean pulmonary arterial pressure (PAPm) in series 1. Differences are shown in values obtained after normoxia and the 1st and 2nd h of hypoxia in controls, intravenous (iv) acetazolamide (ACZ), per os (po) ACZ, and inhaled ACZ. B: ΔPAPm in series 2. Differences are shown in values obtained after normoxia and the 1st and 2nd h of hypoxia in controls, iv ACZ, N-methyl-acetazolamide (NMA), and methazolamide (MTZ). Values are means ± SD; n = 7 (A) and 6–9 (B). *P < 0.05 vs. normoxia. †P < 0.05 vs. controls.

