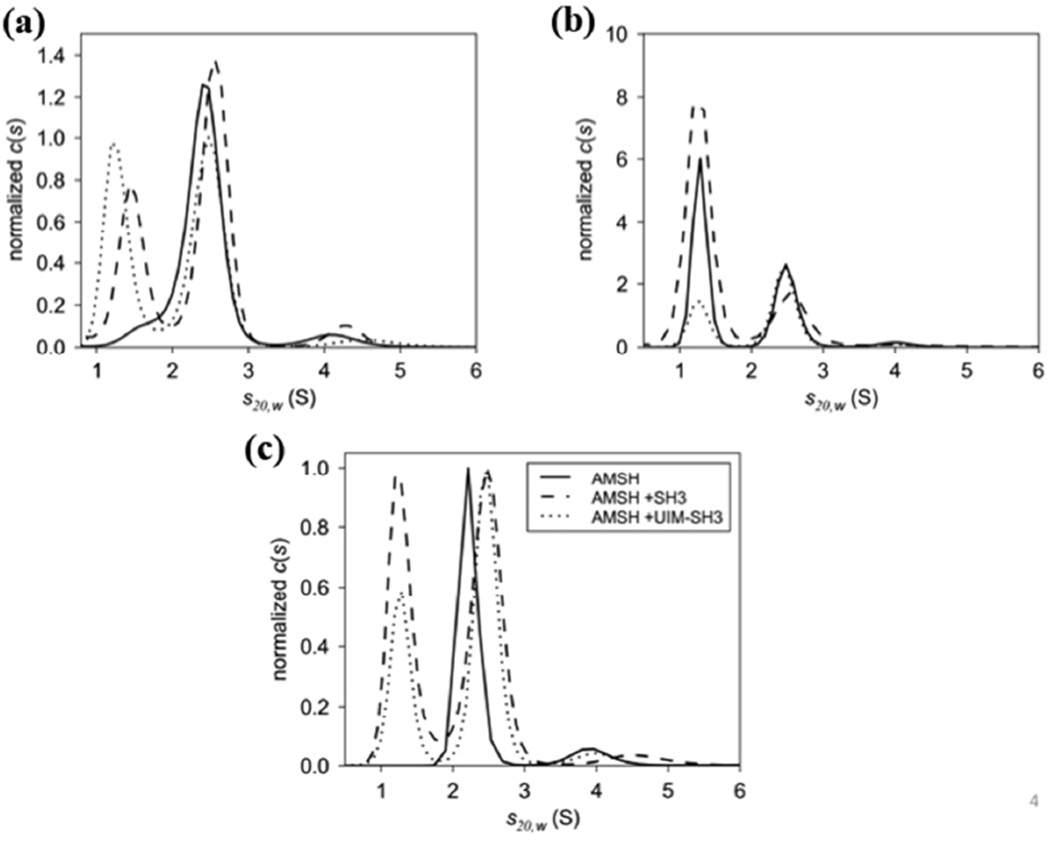
Figure 5.
c(s) distributions of the catalytic domain of AMSH binding to (a) the SH3 domain of STAM and (b) UIM-SH3. Three concentration series were used to assess the formation of the AMSH:SH3 and AMSH:UIM-SH3 complexes revealing 1:1 complexes at 2.5S and 2.6S, respectively. Excess SH3 and UIM-SH3 are present at 1.3S. The data for both c(s) distributions were normalized to the peak area of the complexes. (C) Overlay of AMSH, AMSH:SH3, and AMSH:UIM-SH3 revealing changes in s-value of the AMSH:SH3 and AMSH:UIM-SH3 complexes compared to AMSH alone at 2.2S. The c(s) distributions were normalized to the peak area of the complexes.

