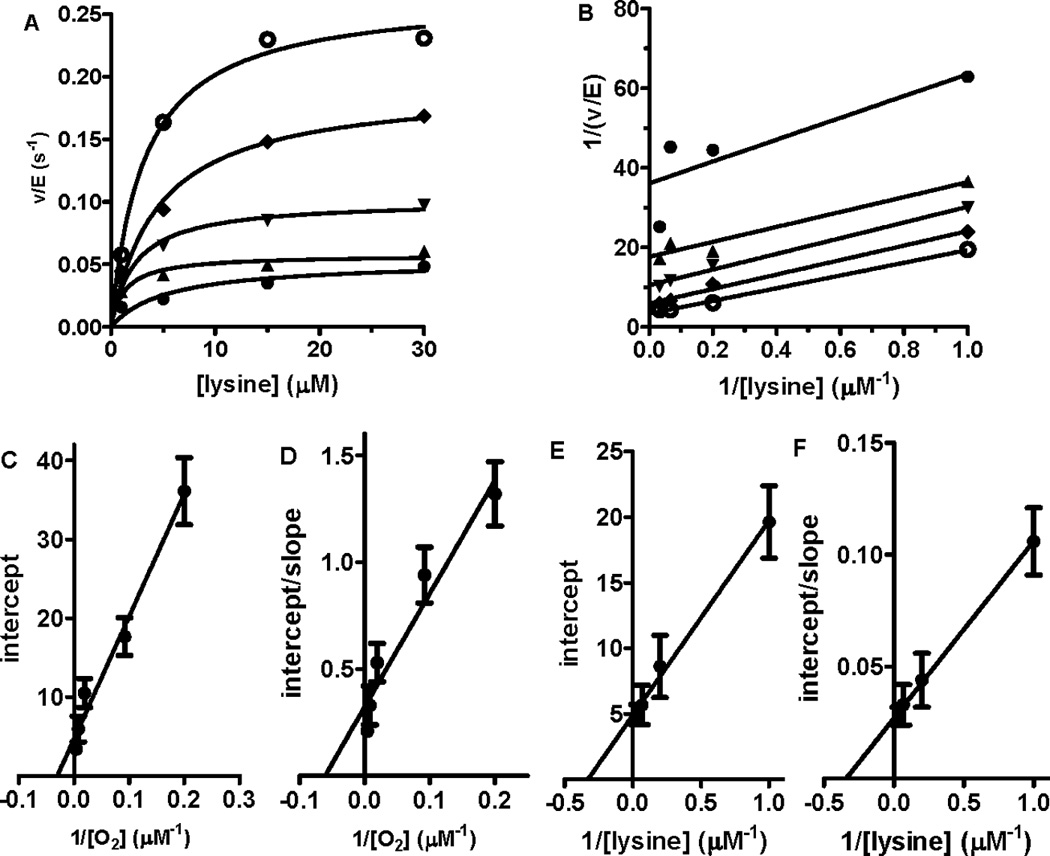
Figure 2.

Steady-state kinetic analysis of LodA. A. Initial rates were determined at different concentrations of lysine in the presence of a fixed concentration of 252 (○), 129 (♦), 54 (▼), 11 (▲) or 5 (●) µM O2. B. Double reciprocal plot of the data shown in panel A. C. Secondary plots of the y-intercept (1/apparent kcat) from panel B versus 1/[O2]. Data are fit by eq 3. D. Secondary plots of the y-intercept/slope (1/apparent Klysine) from panel B versus 1/[O2]. Data are fit by eq 4. E. Secondary plots of the y-intercept (1/apparent kcat) from plots of v/E versus [O2] against 1/[lysine]. Data are fit by eq 3. F. Secondary plots of the y-intercept/slope (1/apparent KO2) from plots of v/E versus [O2] against 1/[lysine]. Data are fit by eq 4. Error bars are indicated in the secondary plots (C–F).
