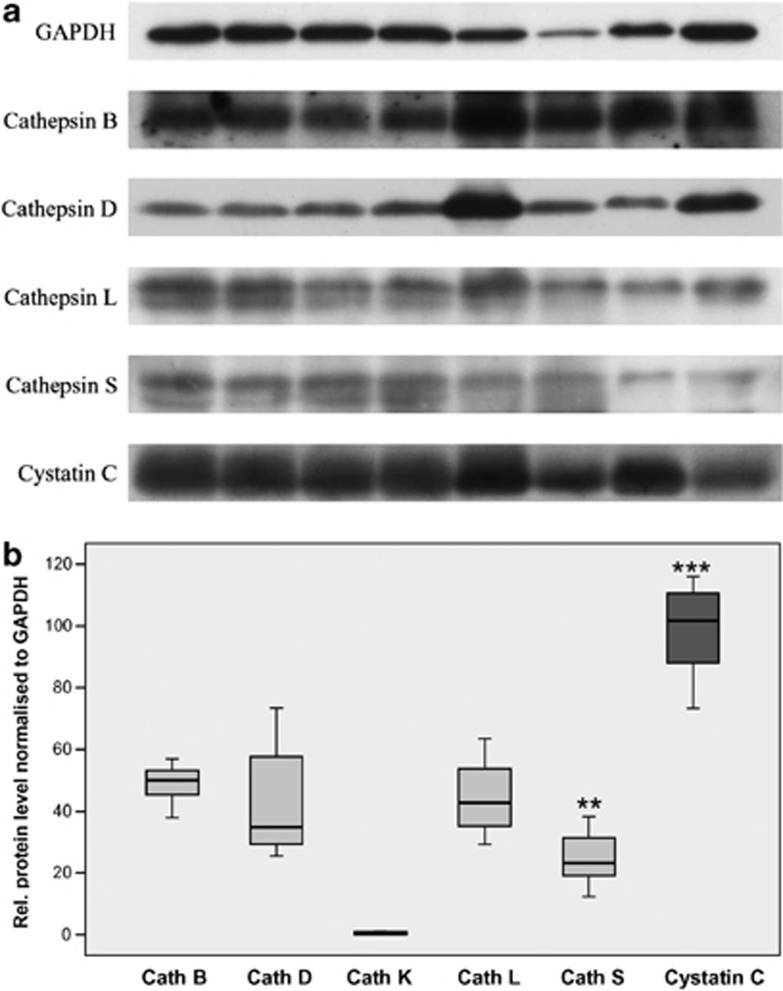
Figure 3.
Expression of cathepsins B, D, K, L and S and cystatin C at the protein level in AAA tissue samples, as analyzed by western blot (a), and the summary of quantitative analysis of the band intensity of the single proteinases and their inhibitor cystatin C (b). Fresh tissues samples were used. The intensities of the bands following blotting and chemiluminescence detection were normalized to GAPDH. Expression was adjusted to that of cystatin C, which was set as 100%. AAA, abdominal aortic aneurysm; Cath, cathepsin; GAPDH, glyceraldehyde 3-phosphate dehydrogenase. **P<0.01, ***P<0.001.

