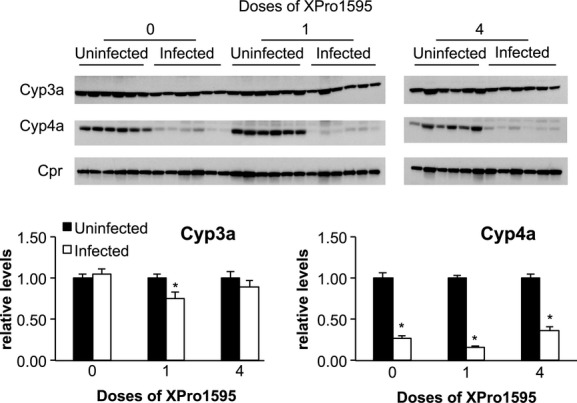
Figure 4.

Effect of TNF-α antagonist on P450 protein expression following Citrobacter rodentium infection. Upper panels: Representative Western blots for Cyp3a, Cyp4a, and Cpr. Equal amounts of protein were loaded in each lane. Lower panels: Quantitative analyses of the data. Cyp3a and Cyp4a protein band intensities were normalized to the intensity of Cpr, used here as a loading control. Protein levels are expressed relative to the levels in uninfected mice without XPro1595 treatment, which was arbitrarily set at 1. Values represent mean ± SEM. *Significantly different from uninfected animals in same XPro1595 treatment group, P < 0.05, n = 6.
