
Figure 7.
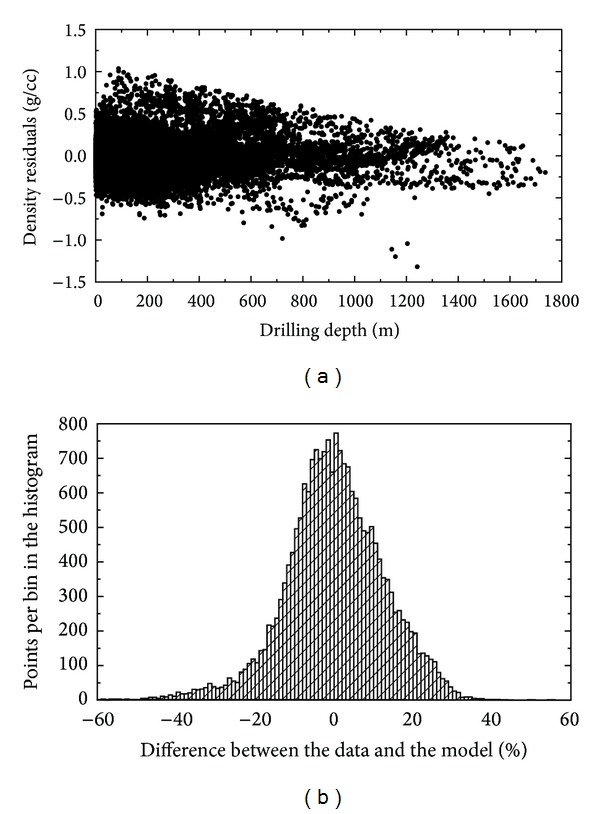
Errors of the 3D sediment density model in (3). Scatter plot and histogram of the differences between the measured and theoretical density values. The density differences are plotted with respect to the sediment depth. Statistics of the differences: standard deviation = 0.22 g/cm3, max = 1.04 g/cm3, and min = −1.32 g/cm3. The histogram shows the relative distribution of the density differences.