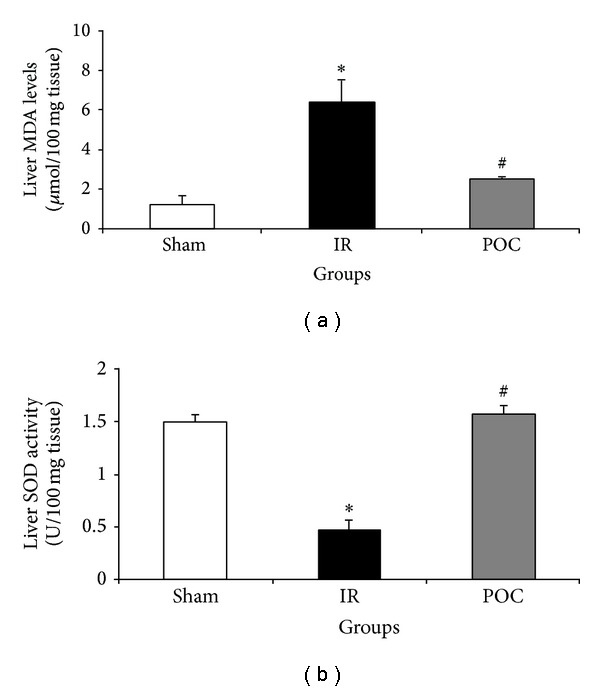
Figure 2.

Changes in liver MDA levels (a) and SOD activity (b) in different groups. The data are presented as mean ± SEM. *P < 0.05 versus sham group. # P < 0.05 versus IR group. IR: 45 min renal ischemia followed by 24 hours of reperfusion. POC group: 4 cycles of 10 seconds of intermittent IR just at the beginning of reperfusion in the kidney.
