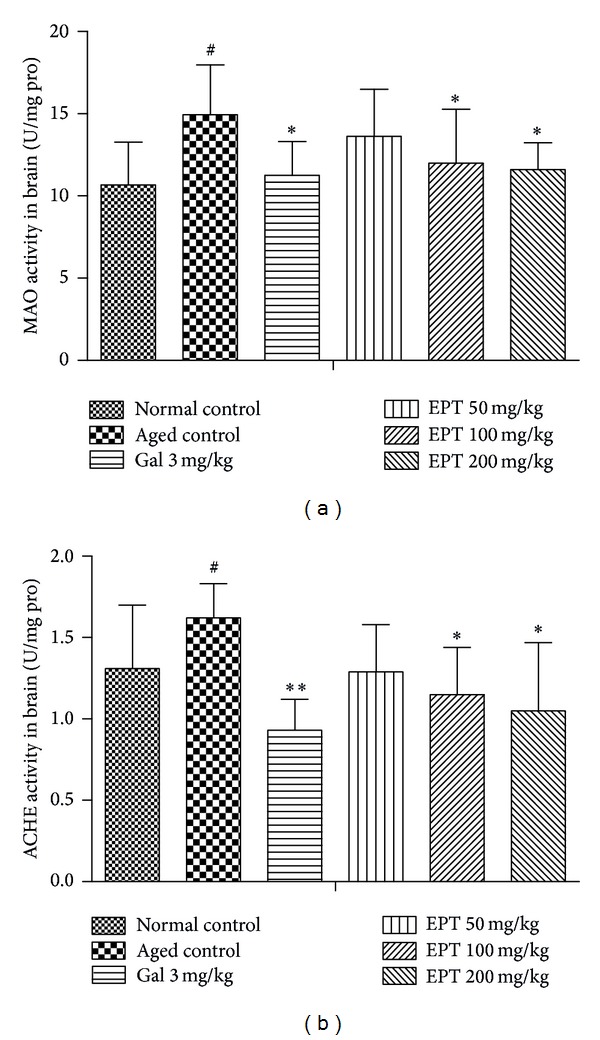
Figure 7.

Effect of EPT on the changes of MAO (a) and AChE (b) activities in mice. Each value represents the mean ± S.E.M (n = 8–10 in each group). Gal represents galantamine 3 mg/kg group. # P < 0.05, versus the normal control group; *P < 0.05 and **P < 0.01, versus the aged control group.
