Figure 1.

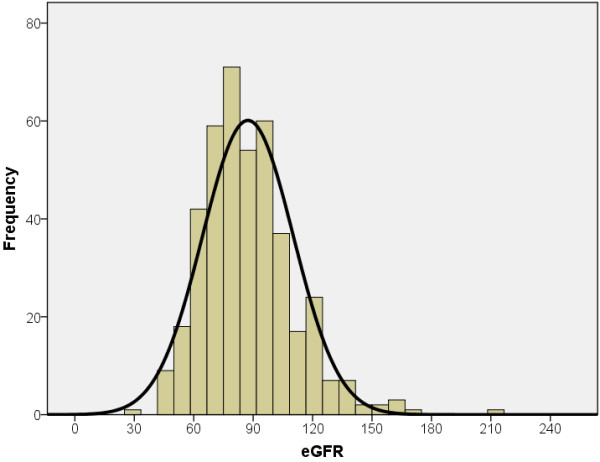
Distribution of eGFR in study participants. The histogram of eGFR from 415 study participants indicates a skewed distribution of the group with mean eGFR of 87.4 with a standard deviation of 22.9 mL/min/1.73 m2.

Distribution of eGFR in study participants. The histogram of eGFR from 415 study participants indicates a skewed distribution of the group with mean eGFR of 87.4 with a standard deviation of 22.9 mL/min/1.73 m2.