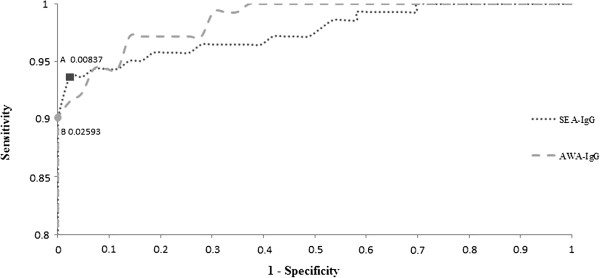
Figure 1.

The receiver operating characteristic (ROC) curves of SEA-IgG and AWA-IgG. The ROC curve analysis was performed in order to determine the cut off values of SEA- and AWA-IgG. Youden indexes were maximized at point A (0.00837) and B (0.02593) respectively on ROC curves.
