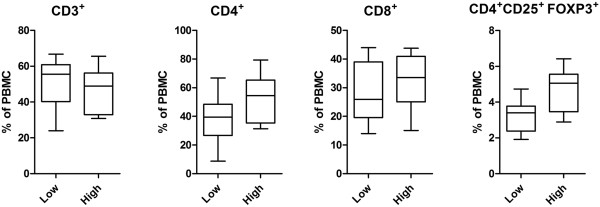
Figure 3.

Proportions (%) of T lymphocytes in PBMCs of low and high antibody responders. Proportions of CD3+, CD4+, CD8+, CD4+ CD25+FoxP3+ T cells (expressed as % of PBMC) were compared between low and high responder groups. Differences were analysed by multivariate analysis after accounting for the effect of sex and age. Data are presented as whiskers boxplot (10-90 percentiles). No significant difference was detected between the two groups.
