
Figure 1.
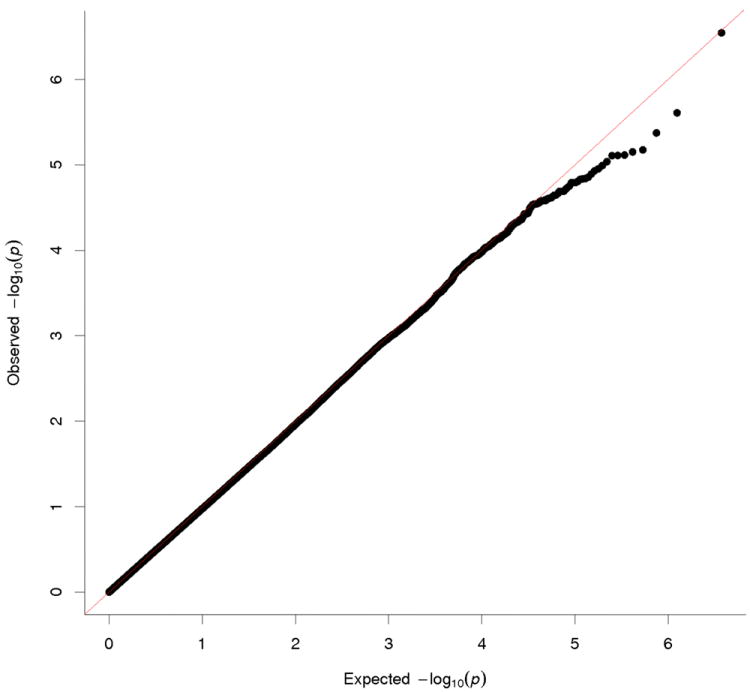
Q-Q plot of the −log10 p-values for the difference between the observed association for the tails of BMI and expected association based on the overall BMI distribution.
Official websites use .gov
A
.gov website belongs to an official
government organization in the United States.
Secure .gov websites use HTTPS
A lock (
) or https:// means you've safely
connected to the .gov website. Share sensitive
information only on official, secure websites.
Q-Q plot of the −log10 p-values for the difference between the observed association for the tails of BMI and expected association based on the overall BMI distribution.