
Figure 2. Variance in extreme obesity explained by common genetic variants.
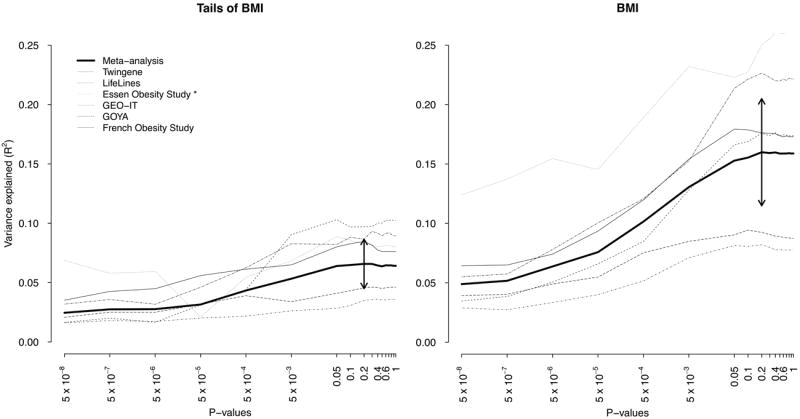
The phenotypic variance explained is higher when SNPs with lower degrees of significance are included in the polygenetic prediction model. The y-axis represents the proportion of variance explained (Nagelkerke R2) of extreme obesity in six studies not included in the discovery meta-analysis. In panel A, the prediction model was based on the results from the stage I meta-analysis of tails of BMI. The thicker lines represent the weighted average; 95% confidence intervals are reported as double-headed arrows. In panel B, the prediction model was based on BMI from the full distribution (modified version of the previous GIANT meta-analysis by Speliotes et al4). * Essen Obesity Study was not adjusted by age.