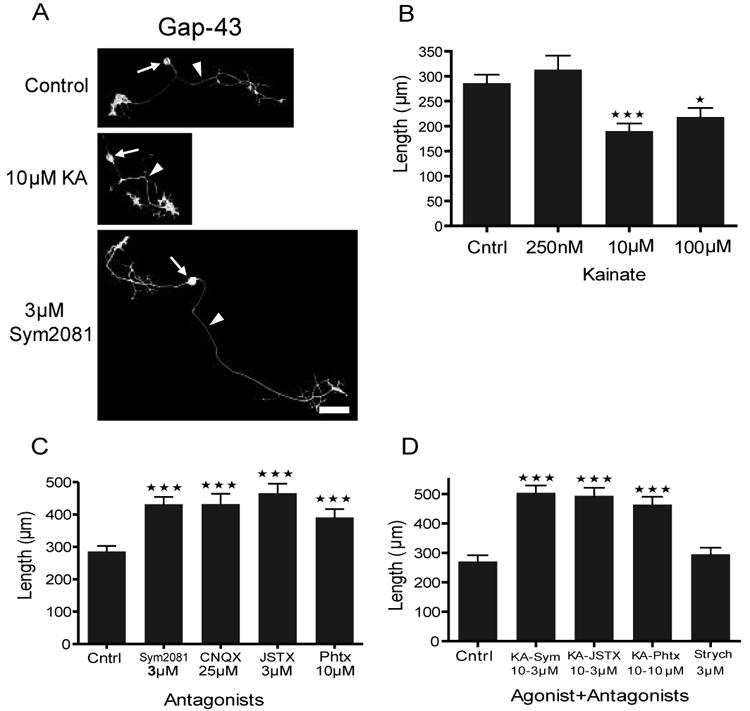
Figure 7.

Quantitative analysis of neurite length when cultures are grown in KA receptor agonists and antagonists. (A) Representative images of GAP-43+ DRG neurons (arrows) under control, KA receptor activating, and blocking conditions. Arrowheads point to a typical longest neurite measured. (B) Kainate (10 and 100 μM) depressed neurite length (n = 98, 41, 54, and 41; with mean length of 286 ± 17, 314 ± 28, 190 ± 16, 218 ± 18 μm for control, 250 nM, 10 μM, and 100 μM KA, respectively). (C) Blockade of all KA receptors with SYM 2081 and CNQX and the Ca2+-permeable receptors with JSTX and PhTX enhanced neurite length (n = 98, 88, 42, 67, and 58; with mean length of 286 ± 17, 432 ± 23, 432 ± 32, 466 ± 29, 391 ± 26 μm for control, SYM 2081, CNQX, JSTX, and PhTX, respectively). (D) Simultaneous activation and blockade of these receptors reproduced similar results to antagonists alone (n = 53, 53, 60, 47, and 67; with mean length of 271 ± 21, 504 ± 23, 494 ± 27, 464 ± 27, 295 ± 22 μm for control, KA + SYM 2081, KA + JSTX, and KA + PhTX, and strychnine, respectively. All values are expressed as mean ± SEM and *P < 0.05, **P < 0.005, ***P < 0.0005 by one way ANOVA followed by Dunnett's multiple comparison post hoc tests. Scale bar is 50 μm.
