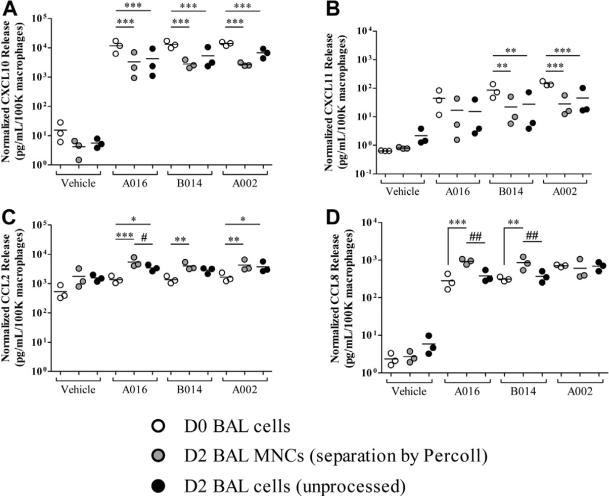
FIG E2.
Comparison of macrophage responsiveness to RV before and after Percoll separation: CXCL10 (A), CXCL11 (B), CCL2 (C), and CCL8 (D). White, D0 BAL cells; gray, D2 BAL MNCs (after separation by Percoll); black, D2 BAL cells (without Percoll processing). The data are normalized to 1 × 10⁵ macrophages plated per treatment condition and displayed as 3 individual subjects and the mean. *P < .05, **P < .01, and ***P < .001 compared with D0 BAL cells and #P < .05 and ##P < .01 D2 BAL cells compared with D2 BAL MNCs; all comparisons tested by 2-way repeated-measures ANOVA with Bonferroni posttests.

