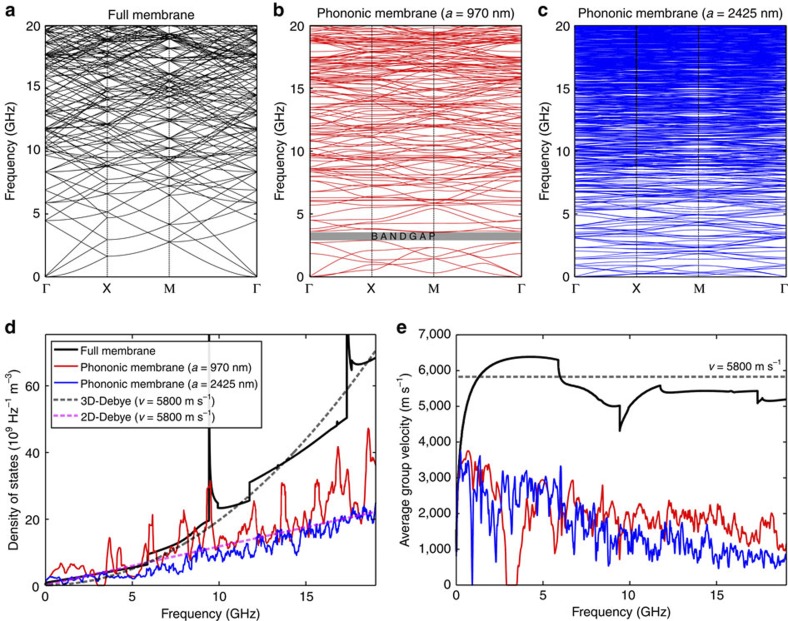
Figure 3. Band structure DOS and group velocity.
Dispersion relations (band structure) in the main symmetry directions of the BZ for the SiN (a) full membrane (d=485 nm), (b) square lattice PnC, with f=0.7 and a=970 nm, and (c) square lattice PnC, with f=0.7 and a=2425, nm. Complete band gap is observable at 3.3 GHz for the PnC with a=970 nm. (d) The corresponding densities of states (PnC a=970 nm, red, PnC a=2425, nm, blue, full membrane, black) with 2D (pink dash) and 3D (grey dash) Debye models. (e) Average group velocity (averaged over the whole 2D BZ) for full (black) and the two PnC membranes (PnC a=970 nm, red, PnC a=2425, nm, blue). The PnC DOS and group velocity curves have been smoothed for visual clarity.

