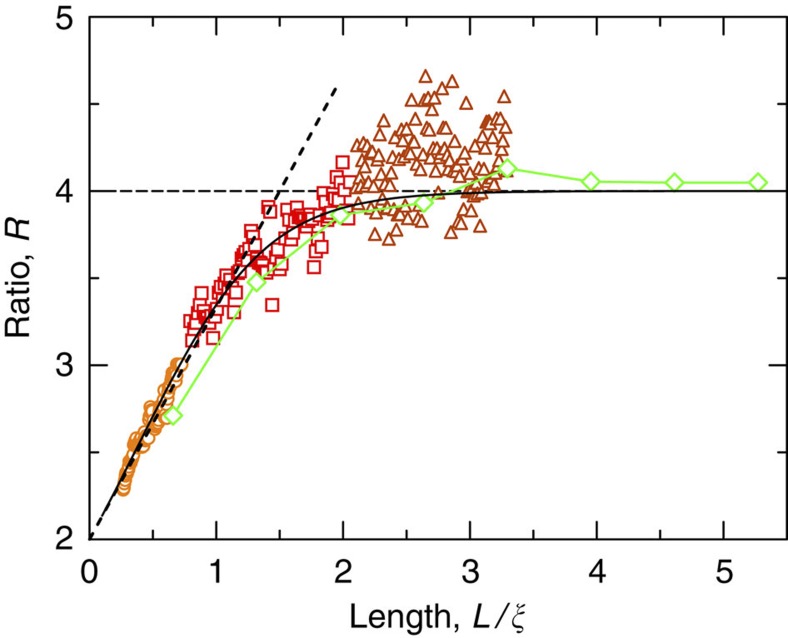
Figure 1. Cross-over to the single-channel regime of transport.
The cross-over to the single-channel regime is charted in terms of the ratio R of the statistical moments of the normalized transmitted intensity  and the normalized transmittance
  ,
,  , as a function of L/ξ. From the microwave experiment, R was obtained in sample A (orange circles), C (red squares) and D (brown triangles). The data points of the same colour and style correspond to different frequencies in samples of the same filling fraction and length. In the numerical simulations, planar disordered waveguides of eight different lengths were considered at a single scattering frequency (green line-connected diamonds). Both the experimental and numerical data agree well with exact non-perturbative calculations of R for a quasi-1D geometry shown by the black solid line. The black dotted line represents the perturbative limit of R, for L/ξ<<1, R=2+4L/3ξ and the black dashed line represents the single-channel value R=4 in the deeply localized limit.

