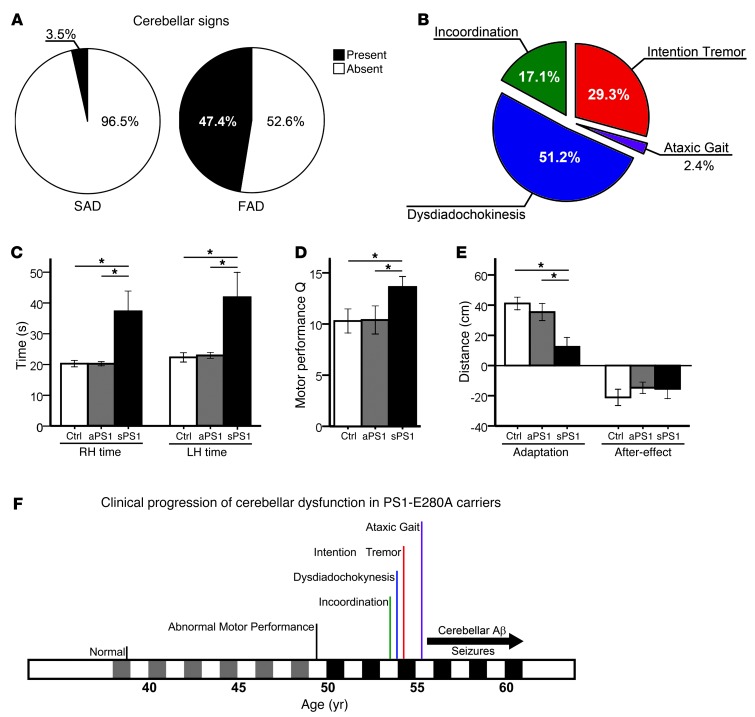
Figure 1. Cerebellar ataxic phenotype in E280A-FAD patients.
(A) Prevalence of cerebellar signs in E280A-FAD patients (FAD, n = 135) against their prevalence in patients with SAD (n = 85). (B) Distribution of cerebellar signs among affected PS1-E280A patients (n = 64). (C) Cerebellar test performance in asymptomatic (aPS1, n = 10) and symptomatic (sPS1, n = 9) PS1-E280A carriers as well as age-matched healthy controls (Ctrl, n = 10). Bar graphs represent measurement of time to completion of 9-Hole Peg test with right hands and left hands (RH and LH). (D) PAT performances. Bar graphs for PAT shows sPS1 subjects with significantly more baseline errors. (E) sPS1 subjects showed less adaptation in PAT test than controls. Both groups of PS1-E280A carriers performed equally in the after-effect. *P < 0.05, data are mean ± SEM, 2-tailed t test. (F) Clinical progression of cerebellar dysfunction in PS1-E280A carriers. Predementia is portrayed in gray and dementia is portrayed in black alongside the timescale. Onset and duration of Aβ deposits in the cerebellum and seizures are depicted with a black arrow.

