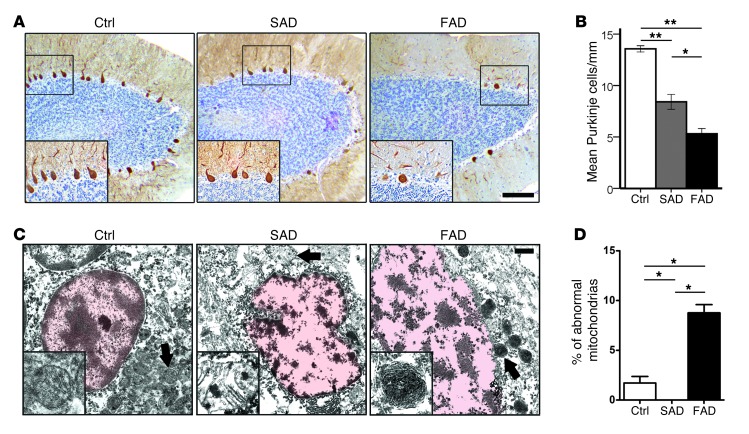
Figure 2. Increased PC loss and abnormal mitochondria structure in PS1-E280A.
(A) Immunohistochemical analysis and quantification of PCs in cerebellar vermes of age-matched controls and patients with SAD and FAD (Ctrl and FAD, n = 10; SAD, n = 11) using calbindin antibody as a marker for PCs. Insets in microphotographs show high-magnification views of boxed areas. Scale bar: 100 μm. (B) There are fewer PCs in patients with AD compared with controls (P < 0.001) and fewer PCs in patients with FAD compared with patients with SAD (P < 0.05). *P < 0.05, **P < 0.01, data are mean ± SEM, Mann-Whitney U test. (C) Ultrastructural analysis of PCs of age-matched controls and patients with SAD and FAD (all groups n = 3, representative pictures) showing nuclei (outlined in light red) and surrounding mitochondria. Mitochondria of all groups show typical postmortem changes (swollen mitochondria, blurry cristae). Only E280A-FAD show pathological mitochondria filled with electron dense material resembling mitochondria undergoing mitophagy. Insets show mitochondria (arrows). Scale bar: 1 μm. (D) Percentage of abnormal mitochondria in analyzed groups. *P < 0.05, data are mean ± SEM, Mann-Whitney U test.

