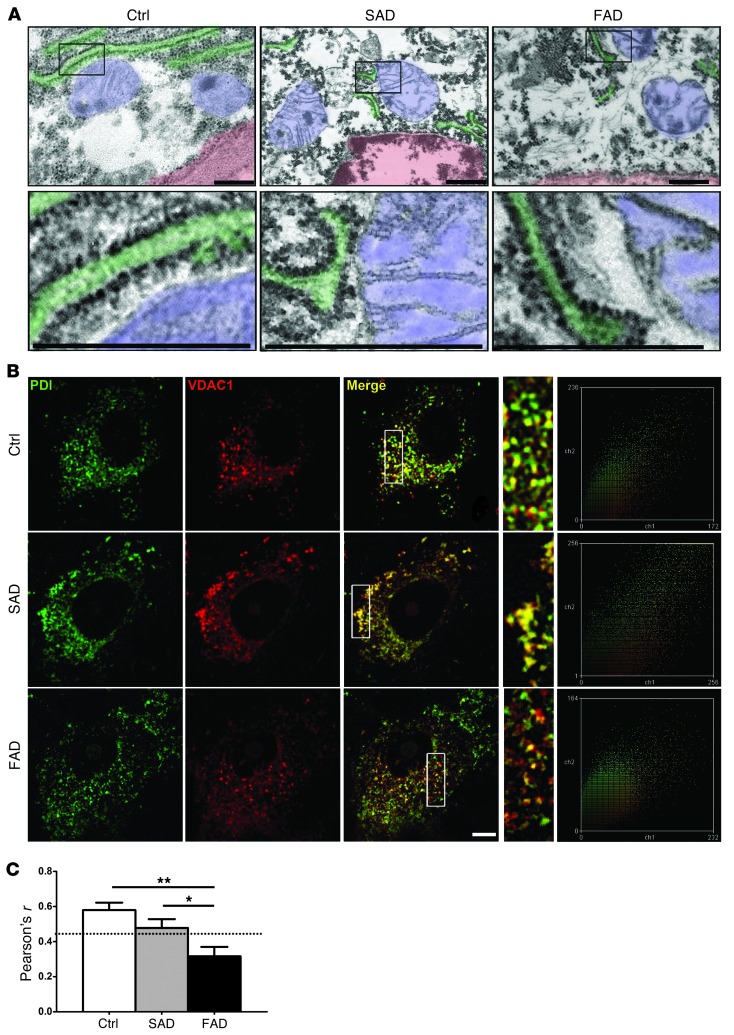
Figure 3. Decreased ER/mitochondria interaction in PS1-E280A PCs.
(A) Ultrastructural analysis of PCs of age-matched controls and patients with SAD and FAD (all groups n = 3, representative pictures) showing nuclei (outlined in light red), mitochondria (light blue), and rough ER (light green). Boxes depict ER/mitochondria interfaces; higher magnification images of boxed areas are shown on the bottom row. E280A-FAD mitochondria show no evident direct interaction with rough ER. Scale bar: 100 nm. (B) Representative confocal fluorescent micrographs and corresponding scatter plots of PCs from controls (n = 3) and patients with SAD (n = 3) and FAD (n = 3) using mitochondrial marker VDAC1 (red) and ER marker PDI (green). Area within white boxes is shown at higher magnification for evaluated regions of interest, showing fewer labeled mitochondria and less ER colocalization in E280A-FAD. Scale bar: 20 μm. (C) Pearson’s r analysis of at least 12 PCs in 3 cases for controls and patients with SAD and FAD. Dotted line indicates Pearson’s r significance for colocalization for stated samples (n ≥ 12). *P < 0.05, **P < 0.01, data are mean ± SEM, Mann-Whitney U test.

