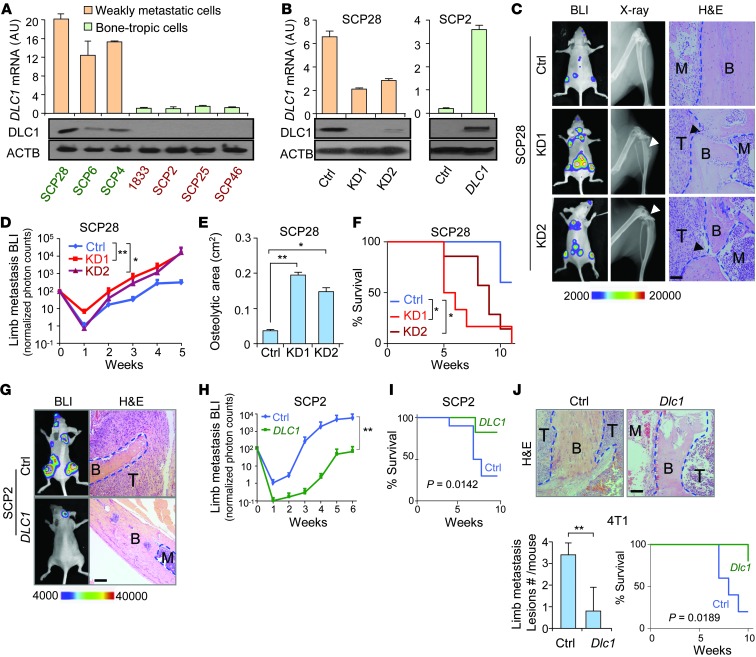
Figure 1. DLC1 suppresses breast cancer osteolytic metastasis.
(A) DLC1 expression in MDA231 derivative cell lines (n = 3). Green and red text denotes cell lines with high and low DLC1 expression, respectively. (B) DLC1 KD and OE in SCP28 and SCP2 cells (n = 3). (C) Representative BLI, X-ray, and H&E images of bone metastases by SCP28 cells. Arrowheads denote areas of overt osteolysis. (D) BLI quantitation of limb metastasis by SCP28 cells (n = 10 per group). (E) Osteolytic area sizes caused by SCP28 cells. (F) Survival of mice injected with SCP28 cells. (G) Representative BLI and H&E images of animals injected with SCP2 cells. (H) BLI limb metastasis burden by SCP2 cells (n = 10 per group). (I) Survival of mice injected with SCP2 cells. (J) In vivo bone metastasis analysis of 4T1 cells with Dlc1 OE in Balb/c mice (n = 10 per group). Shown are H&E images, quantitation of metastasis lesions, and animal survival. Scale bars: 100 μm. B, bone; T, tumor; M, bone marrow or marrow with scattered cancer cell. *P < 0.05, **P < 0.01.

