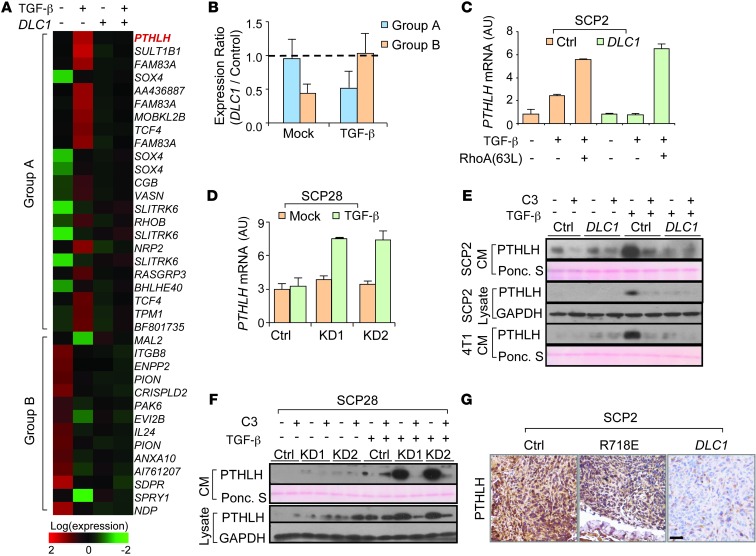
Figure 4. DLC1 blocks TGF-β–induced PTHLH expression and secretion.
(A) Expression heatmap of genes regulated by TGF-β, but reversed by DLC1, in SCP2 cells. (B) Expression ratios of the 2 gene groups in DLC1 OE and control cells when cells were untreated or treated with TGF-β (n = 3). Data represent ratio median ± median absolute deviation (MAD). (C) PTHLH mRNA levels in SCP2 cells with DLC1 OE (n = 3). (D) PTHLH mRNA levels in SCP28 cells with DLC1 KD (n = 3). (E) Intracellular and extracellular PTHLH protein levels in SCP2 and 4T1 cells with DLC1 OE. (F) Intracellular and extracellular PTHLH protein levels in SCP28 cells with DLC1 KD. (G) PTHLH IHC analyses in bone metastases from animals inoculated by control SCP2 cells or the cells with WT and mutant DLC1 OE. Scale bar: 50 μm.

