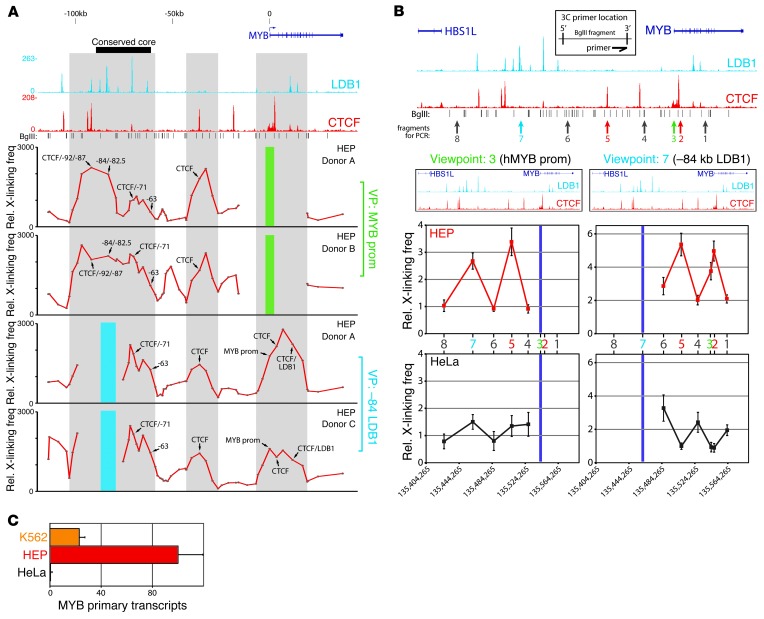
Figure 4. 3C analysis of the HBS1L-MYB locus reveals long-range interactions between intergenic elements and the MYB gene.
(A) 3C-Seq analysis performed on primary HEPs from 3 different donors using the MYB promoter (green bar) or the –84 regulatory element (blue bar) as a viewpoint (VP). LDB1 and CTCF ChIP-Seq results from primary HEPs and gene locations are shown at the top. Gray shading highlights regions of coinciding protein binding and chromatin looping. The y axis represents relative crosslinking frequencies per BglII fragment as measured by sequence tag density. (B) 3C-qPCR experiments on primary HEPs (red, n = 5) and HeLa cells (gray, n = 3) using the same viewpoints as in A. The locus is plotted on top, with the different 3C restriction fragments (BglII) used for PCR indicated. A schematic depicting the location of the primers on the chosen restriction fragments is shown. Interaction frequencies between 2 fragments within the ERCC3 locus were used for normalization. (C) Gene expression analysis (n = 3) of MYB transcript levels in the different cell types used for the 3C analysis. ACTB levels were used for normalization. Error bars display SEM.

