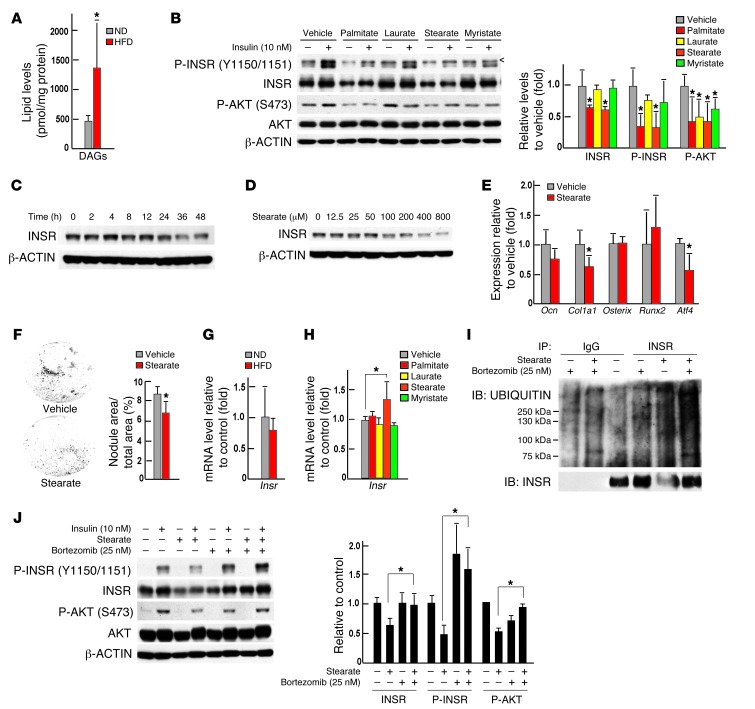
Figure 6. Lipotoxicity caused insulin resistance in osteoblasts.
(A) DAG content in bones of WT mice fed a normal diet or a HFD (n = 5). (B) Western blot analysis of the phosphorylation levels of INSR and AKT in primary osteoblasts treated with 200 μM sFAs or vehicle for 48 hours. < denotes a nonspecific band detected by the phospho-insulin receptor β (Tyr1150/1151) antibody (no. 3024, Cell Signaling Inc.). (C) Western blot analysis of levels of total INSR in primary osteoblasts treated with 200 μM stearate for 0 to 48 hours. (D) Western blot analysis of levels of total INSR in primary osteoblasts treated with 0 to 800 μM stearate for 48 hours. (E) qPCR analysis of the expression of osteoblast marker genes in primary osteoblasts treated with 200 μM stearate for 24 hours (n = 6). (F) Mineralization nodules in primary osteoblasts treated with 200 μM stearate for 6 days (n = 6). (G) qPCR analysis of the expression of Insr in bones of WT mice fed a normal diet or a HFD (n = 7). (H) qPCR analysis of the expression of Insr in primary osteoblasts treated with 200 μM sFAs or vehicle (n = 6). (I) Western blot analysis of levels of total and ubiquitinated forms of INSR in primary osteoblasts treated with 200 μM stearate or vehicle and/or 25 nM bortezomib. (J) Western blot analysis of insulin signaling in osteoblasts treated with 200 μM stearate or vehicle and/or 25 nM bortezomib. All Western blot experiments were repeated 3 times. *P ≤ 0.05.

