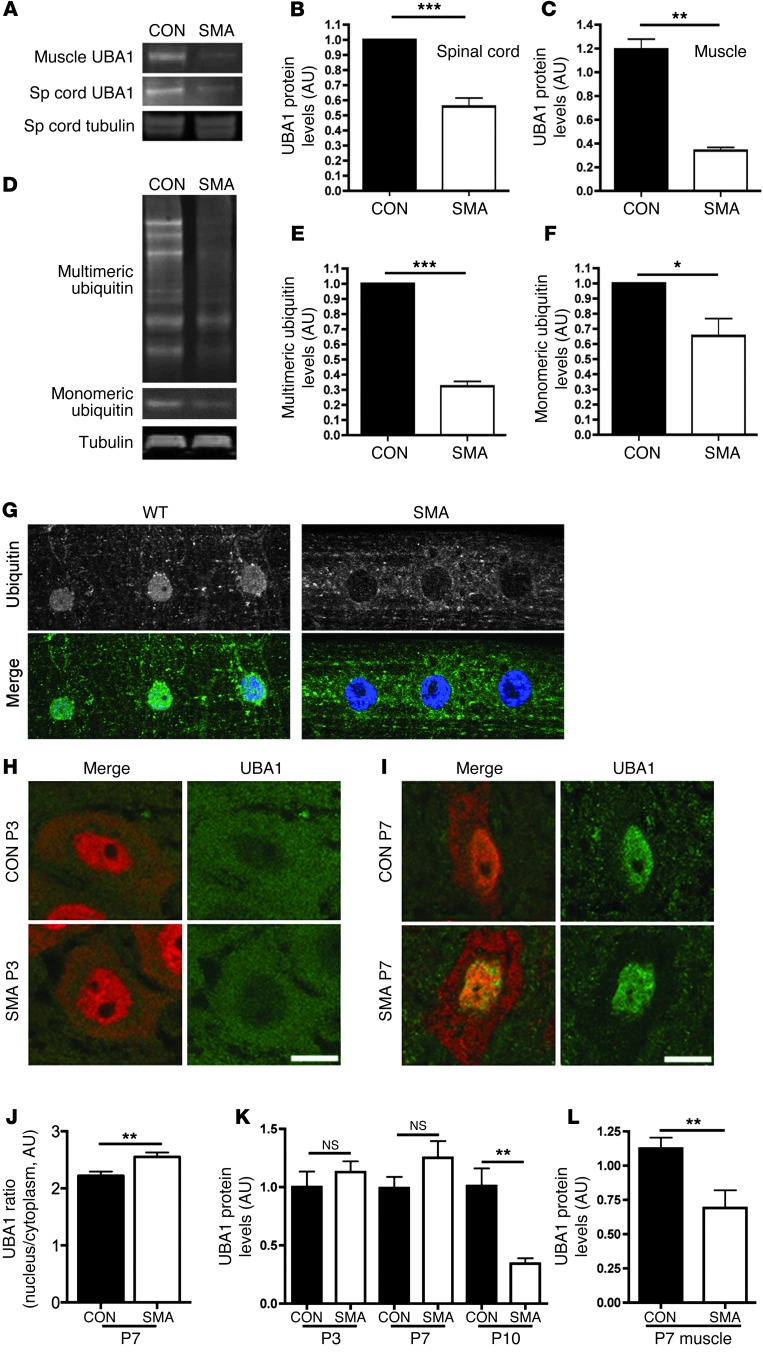
Figure 1. Perturbations in UBA1 levels and ubiquitin homeostasis in mouse and Drosophila models of SMA.
(A–C) Significant reduction in levels of UBA1 protein in spinal cord and skeletal muscle from severe SMA mice at P5 compared with littermate controls (con), quantified using fluorescent Western blot (n = 3 mice/genotype; unpaired 2-tailed t test). (D–F) Reduced levels of both monomeric and multimeric ubiquitin in the spinal cord of Taiwanese SMA mice at P10 (tubulin: loading control; n = 3 mice/genotype). (G) Representative confocal micrographs of striated muscle from WT and SMA Drosophila larvae immunolabeled with an antibody that recognizes mono- and polyubiquitinated proteins (green). Diffuse staining in muscle and muscle nuclei (stained with Hoechst, blue) of WT flies contrasted with a distinct lack of nuclear staining and increased perinuclear staining in SMA flies. Each panel in G is 75 μm in length. (H and I) UBA1 (green) and NeuN (red) immunolabeling of motor neurons from Taiwanese SMA and littermate control mouse spinal cords at P3 (H) and P7 (I). Note how UBA1 was predominantly cytoplasmic at P3 but nuclear at P7. Scale bars: 10 μm. (J) Significant increase in the ratio of nuclear to cytoplasmic UBA1 in SMA motor neurons at P7 compared with littermate controls (n = 24 motor neurons per genotype). (K) UBA1 levels in whole spinal cord of Taiwanese SMA mice remained unchanged at P3 and P7, but were significantly reduced by P10 (n > 3 mice per time point/genotype; ANOVA with Tukey’s post-hoc test). (L) Levels of UBA1 in skeletal muscle were significantly reduced at an early symptomatic age (P7) in Taiwanese SMA mice (n = 4 mice per genotype). *P < 0.05; **P < 0.01; ***P < 0.001.

