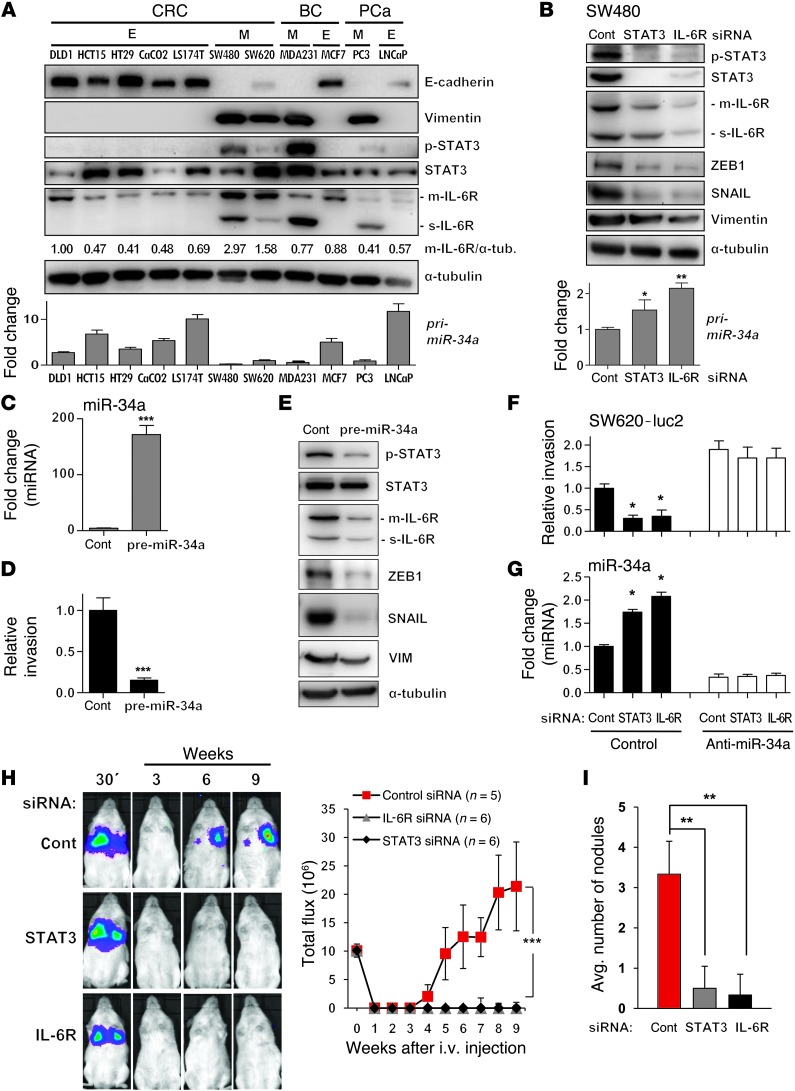
Figure 3. The mesenchymal phenotype of cancer cell lines is associated with the IL-6R/STAT3/miR-34a loop.
(A) Expression of the indicated proteins and primary miRNAs in CRC, breast cancer (BC), and prostate cancer (PCa) cell lines exhibiting epithelial (E) or mesenchymal (M) phenotypes was determined by Western blot (upper panel) and qPCR analysis (lower panel). Relative densitometric quantifications of m–IL-6R protein normalized to α-tubulin are indicated. (B) Detection of protein and RNA expression 48 hours after transfection with the indicated siRNAs. (C, D, and E) Expression of miR-34a (C), invasion (D), and expression of indicated proteins (E) in SW480 cells transfected with control or pre–miR-34a oligonucleotides for 48 hours. (F) Relative invasion of SW620-luc2 cells transfected with STAT3- or IL-6R–specific siRNAs and miR-34a–specific antagomirs. (G) qPCR analysis of mature miR-34a in cells treated as in F. (H and I) SW620-luc2 cells were transfected with control, STAT3-, or IL-6R–specific siRNAs for 48 hours, subsequently injected into the tail vein of NOD/SCID mice, and followed by noninvasive bioluminescence imaging for 9 weeks. In H, the left panels show representative images and the graph shows the photon flux (right). Quantification of metastatic tumor nodules in the lung per mouse 9 weeks after tail-vein injection are shown (I). Mean values ± SD (n = 3) are provided. *P < 0.05; **P < 0.01; ***P < 0.001.

