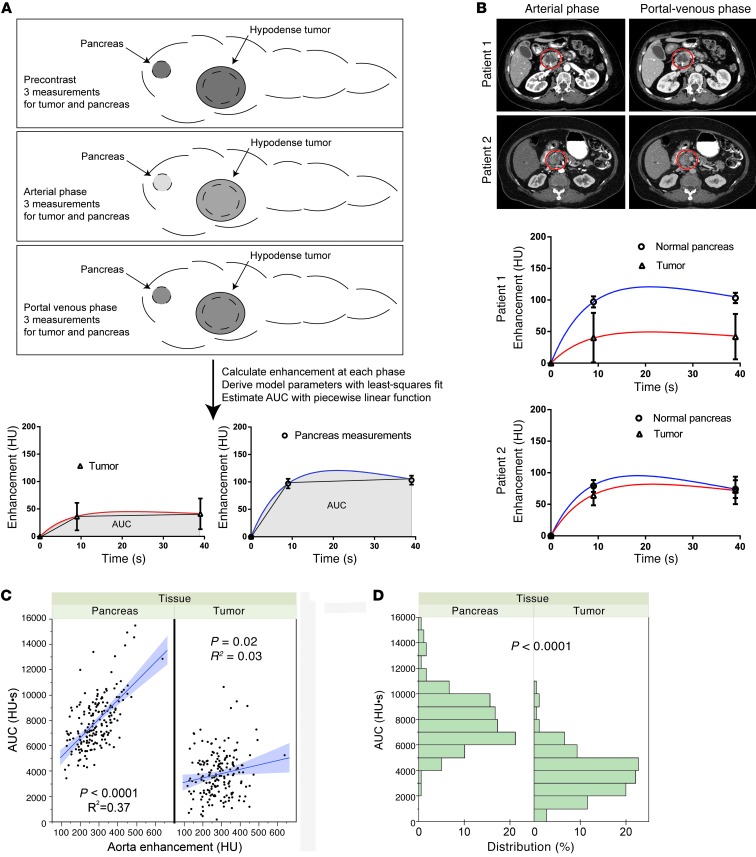
Figure 1. Deriving transport properties of pancreatic tumors from routine CT scans.
(A) Measurement technique. The pancreatic protocol involved well-timed scans in relation to contrast injection: precontrast, arterial phase, and portal venous phase (dashed lines denote representative measurement area). Systematic measurements of the pancreatic tumor and normal pancreas were recorded, and a model was developed to derive transport properties from these measurements. The model function can be integrated with time to derive AUC, and a simple piecewise linear function can be used to estimate AUC. (B) Scans from 2 patients with different enhancement patterns in the normal pancreas and pancreatic tumor are shown. The density changed with time due to intravasation of contrast into the tissues. Modeled density changes are shown, demonstrating that the model provides transport parameters for each patient’s normal tissue (blue line) and cancer (red line). (C) AUC representing the time integral of enhancement in the tissue of interest. The model was validated by comparing tissue-derived parameters with the enhancement in the aorta at the level of the celiac axis, which should reflect enhancement in the tissues. The graph for all 176 patients with pancreatic protocol CTs in this study shows how normal pancreas closely reflected aortic enhancement, whereas pancreatic tumors had higher variability. (D) Distributions of the parameter AUC from CT scans of 176 patients, grouped by pancreatic tissue type. Significant differences in the distribution of transport parameters were evident between normal pancreas and pancreatic tumor, with tumors exhibiting worsened transport properties.

