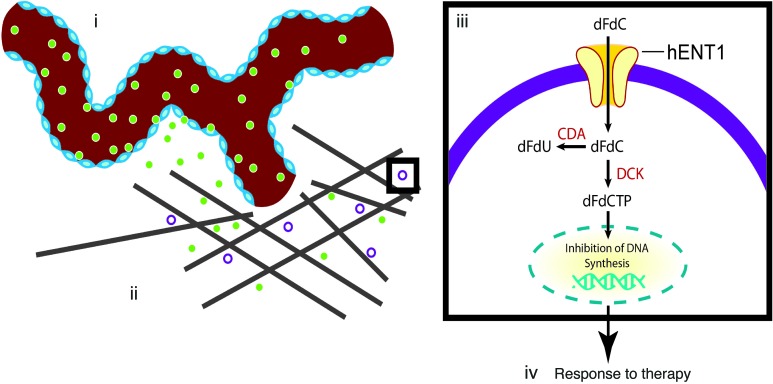
Figure 6. Multiscale transport model of response to therapy.
(i) The CT-derived parameters describe vascular tissue transport qualities (Figure 1) and also reflect underlying histopathology (Figure 3). (ii) The clinical trial demonstrated highly variable drug delivery (Figure 2) and showed that more stroma led to less gemcitabine incorporation (Figure 3). (iii) The clinical trial also illustrated how hENT1 expression can influence gemcitabine incorporation (Figure 3). (iv) The response to and outcome after therapy correlated with the CT-derived parameters (Figures 4 and 5 and Tables 1 and 2). CDA, cytidine deaminase; DCK, deoxycytidine kinase; dFdU, 2′,2′ difluorodeoxyuridine; dFdCTP, 2′,2′ difluorodeoxycytidine triphosphate.

