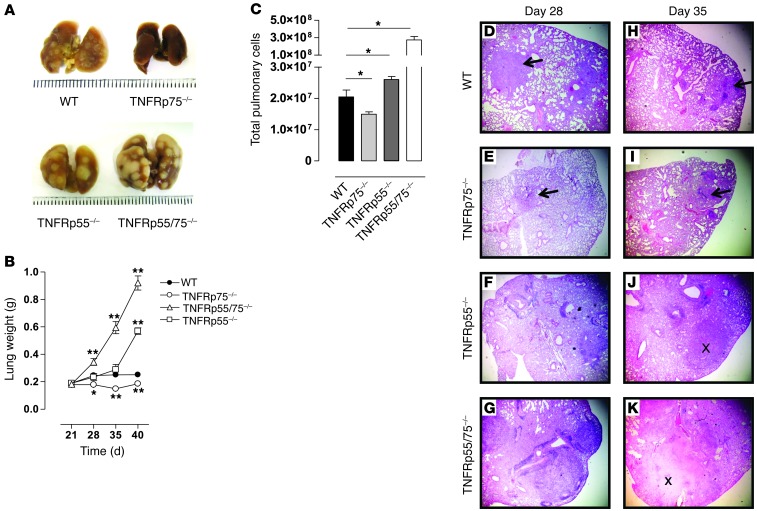
Figure 2. Reduced pulmonary pathology and inflammation in M. tuberculosis–infected TNFRp75–/– mice.
WT, TNFRp75–/–, TNFRp55–/–, and TNFRp55/75–/– mice were infected by aerosol inhalation with 50–100 CFU M. tuberculosis. Mice were sacrificed at the indicated time points, pulmonary pathology was recorded 35 days after infection (A), lung weights were assessed (B), and total pulmonary cell numbers at day 35 after infection were determined (C). Values are mean ± SEM of 4 mice per group. (D–K) Lungs were removed on days 28 (D–G) and 35 (H–K), fixed in formalin, embedded in wax, and sectioned, after which H&E staining was performed. Arrows denote the presence of granuloma structures; × symbols denote tissue necrosis. Original magnification, ×40. Data represent 1 of 3 similar experiments. *P < 0.05, **P < 0.01, ANOVA.

