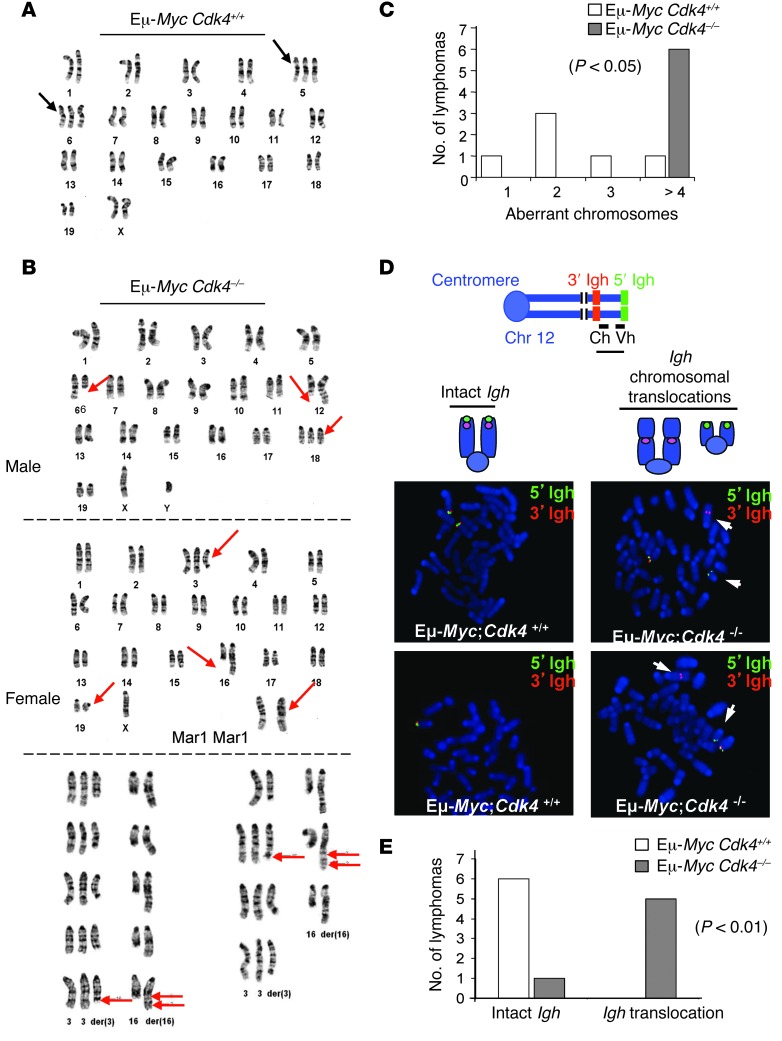
Figure 3. CDK4 deficiency augments genomic instability of Myc-driven lymphoma.
(A) Karyotype of E-MycCdk4+/+ lymphoma. Trisomy of chr 6 and/or chr 5 was evident in most lymphomas. (B) Abnormal karyotypes are a hallmark of Eμ-MycCdk4–/– lymphomas, including deletions of chr 6 at region C2, translocation of chr 6 and chr 12 with breakpoints (6;12)(C2;F1), trisomy of chr 18, loss of chr X, deletions of chr 3 and chr 16 at regions F2.2 and 16, respectively, translocation between chr 3 and chr 16, and the der(16) with [+der(3)t(3;16)(F2.2;C2),der(16)t(3;16) (F2.2;C2)ins(16;?)(C2;?)]. Karyotypes shown are representative of 20 cells for each lymphoma. (C) Statistical analysis of genomic instability in Eμ-MycCdk4–/– versus Eμ-MycCdk4+/+ lymphomas. The numbers of aberrant chromosomes (translocation, partial genomic loss and gain) per lymphoma are shown for Eμ-MycCdk4–/– and Eμ-MycCdk4+/+ lymphomas. Eμ-MycCdk4+/+ lymphomas (n = 6) with 0, 1, 2, and greater than or equal to 3 aberrant chromosomes are indicated. All Eμ-MycCdk4–/– lymphomas (n = 6) had more than 3 aberrant chromosomes (Supplemental Table 3). (D) FISH analyses of Eμ-MycCdk4–/– lymphomas. Metaphase samples of B220+ cells from Eμ-MycCdk4+/+ and Eμ-MycCdk4–/– lymphomas were assessed by FISH with 5′ (green) and 3′ (red) Igh probes that flank the 2Mb Igh locus on chr 12 (37). An intact Igh locus had colocalized red and green signals, while a broken locus had split red and green signals. FISH analyses confirmed complex translocations in Eμ-MycCdk4–/– lymphomas. Original magnification, ×1,500. Ch, constant (C) region of Igh locus; Vh, variable (V) region of Igh locus. (E) Statistical analysis of translocated versus wild-type Igh loci in Eμ-MycCdk4–/– and Eμ-MycCdk4+/+ lymphomas (n = 6, P < 0.01).

