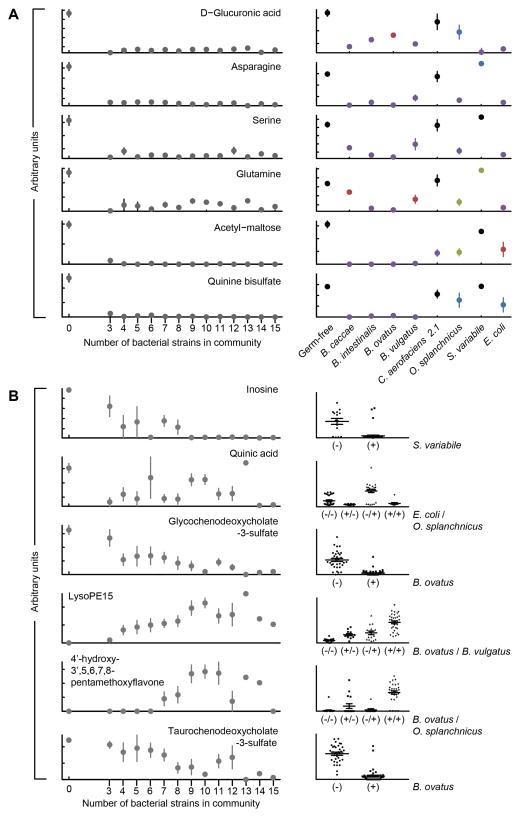
Fig. 3. Bacterial strain-induced alterations in cecal metabolite concentrations.
(A) Metabolites whose levels in the cecum saturate at small community sizes (≤3 strains). A zero on the x-axis refers to germ-free controls. Saturation at low consortia sizes indicates that multiple strains are capable of modulating the metabolite. Mono-colonization (right portion of the panel) directly establishes that specific bacterial strains can alter the level of a given metabolite. Significance of the values are color coded: blue, P<0.05; red, P<0.01; green, P<0.001; purple, P<0.0001 as judged by an unpaired two-tailed Student’s t-test. Shown are mean values ± SEM. These examples represent a subset of the small-community saturated metabolites with high confidence identifications. Data for additional metabolites are presented in table S4. (B) Metabolites with more diverse patterns of changes in their levels as a function of community size reveal cases where fewer community members modulate the metabolite and instances where saturation requires the cumulative influence of multiple bacterial strains. For these metabolites, model-based approaches such as stepwise regression can be used to identify the strains that best explain the alterations in metabolite abundance. Mean values ± SEM are plotted. Each point in the right-hand portion of panel B represents a different community of 3–15 members. The x-axis groups the points into columns based on the strains identified by stepwise regression whose presence (+) or absence (−) in a community best explains the observed variation in metabolite level (P<0.001, F-test). The number of columns represents all possible combinations for presence/absence for the effector strains. The middle and upper/lower lines in each column denote the mean and SEM for all communities in that group.

