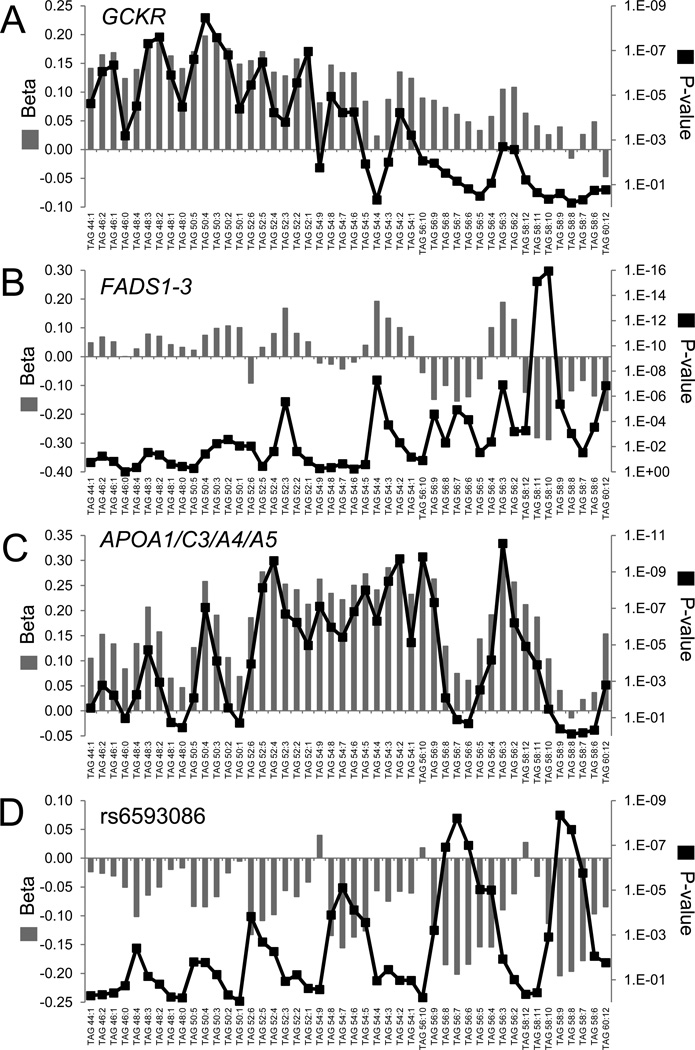
Figure 3. Metabolite profiling demonstrates distinct patterns of TAG associations for select loci.
For the 46 triacylglycerols (TAGs) monitored by our platform, the beta coefficient (left y-axis) and P-value (right y-axis) of association are shown for the top variant at (A) GCKR, (B) FADS1-3, (C) APOA1/C3/A4/A5, and (D) rs6593086.

