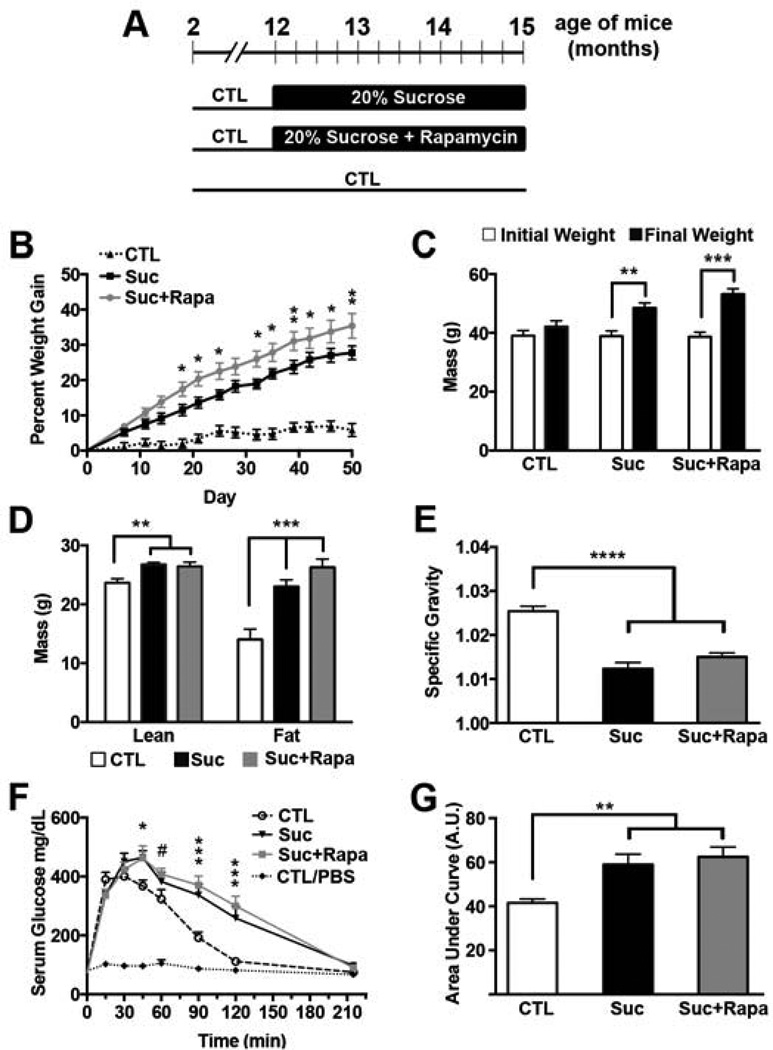
Figure 1. Sucrose-supplemented drinking water induced obesity, osmotic diuresis, and peripheral insulin resistance in 3xTg-AD mice.
(A) Diagram of the experimental design. (B) All mice were weighed when they entered the study, one week after study commencement, and biweekly thereafter. Their weight change was calculated as the percent difference from day 0. 3xTg-ADSuc+Rapa gained significantly more weight than 3xTg-ADCTL at every time point (day 7 p<0.05; day 11 p<0.005; and p<0.0001 each time point thereafter). 3xTg-ADSuc gained significantly more weight than 3xTg-ADCTL beginning at day 14 (day 14: p<0.005, p<0.0001 every time point thereafter). Asterisks indicate a significant difference between 3xTg-ADSuc and 3xTg-ADSuc+Rapa groups (* p < 0.05; **p < 0.005). (C) The graph shows initial weight taken when mice entered the study (day 0) and final weight at day 50. During the course of the study, 3xTg- ADCTL mice gained 6%, 3xTg-ADSuc mice gained 28% and 3xTg-ADSuc+Rapa gained 35% body mass (**p<0.01, ***p<0.001). (D) Fat mass and lean mass as measured by DEXA at the end of the study (* p < 0.01; ** p<0.0005; *** p< 0.0001). (E) Specific gravity (density of urine/density of water) measurements derived from spot urinalysis (p<0.0001). (F) Serum glucose concentrations during GTT, which was conducted after 11 weeks on the altered diet. Symbols indicate significant differences compared to 3xTg-ADCTL: # p < 0.01 and ### p < 0.0001 for both sucrose cohorts; * p<0.05 for only 3xTgADSuc+Rapa. (G) Area under the curve for glucose was calculated using the trapezoid rule (** p < 0.005). A–E n=15 3xTg-ADCTL, n=14 3xTg-ADSuc+Rapa, n=14 3xTg-ADSuc; E–F: n=11 CTL 3xTg-ADCTL; n=4 CTL 3xTg-ADCTL-PBS; n=8 3xTg-ADSuc; n=7 3xTg-ADSuc+Rapa. Statistical analyses were performed by one-way ANOVA (D, E, G) or two-way ANOVA (B, C, F), followed by Tukey’s multiple comparison test if p < 0.05. Results presented as means ± SEM.

