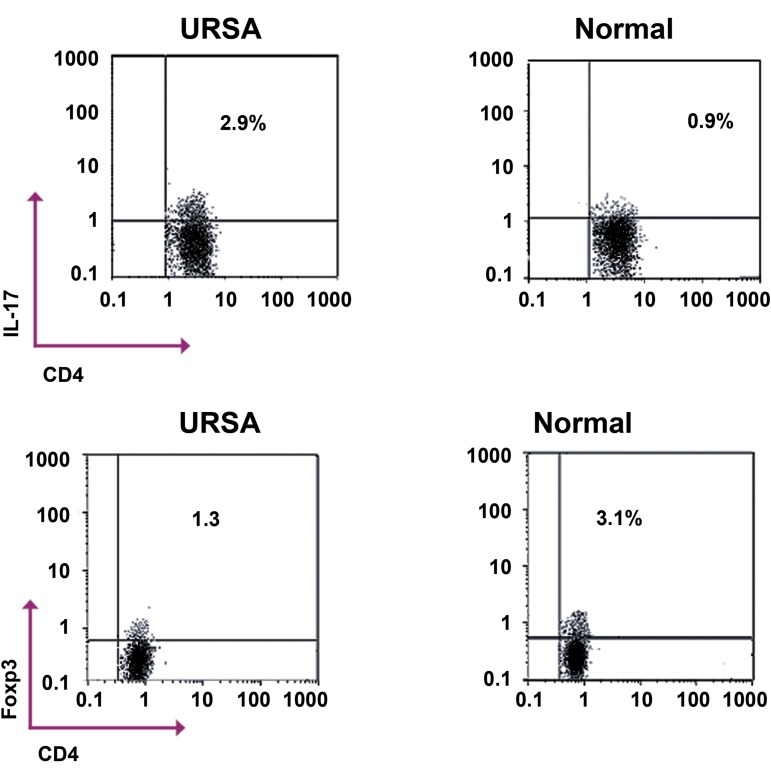
Fig 1.
Representative flow cytometry dot plots of TH17 (CD4+ IL-17A+ ) and Treg (CD4+ FOXP3+ ) in unexplained recurrent spontaneous abortion (URSA) and healthy, normal women. Plots shown were gated on CD4+ lymphocytes. The percentage of cells falling into the respective quadrants is indicated in each plot.
*; Considered significant compared with the control group according to independent sample t test and p=0.001

