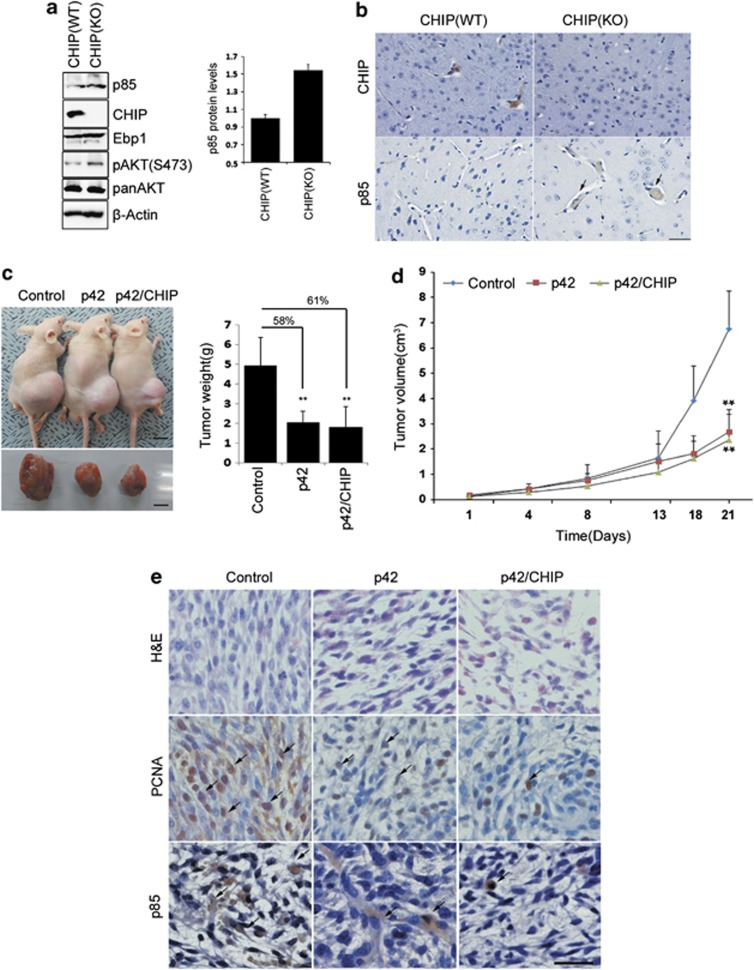
Figure 6.
The p42 represses tumorigenesis in vivo through downregulation of p85. (a and b) Endogenous protein levels were examined in the mouse brain of CHIP-KO or CHIP-WT by immunoblotting and immunohistochemistry. The paraffin blocks were stained with anti-CHIP, anti-p85 antibody. Arrows indicate stained cells. Scale bar: 40 μm. (c and d) U251 cells (5 × 10⁶) were injected subcutaneously into the nude mice. After tumor size reached 5 mm diameter, three groups of viral particles of AAV-GFP, AAV-p42 or AAV-p42 and AAV-CHIP were administrated to tumor region (as described in the Materials and Methods). After 21 days of AAV injection, animals were killed and their tumors were removed. Tumor volumes were measured from bi-dimensional measurements every 3 days and compared. The values shown are mean±S.E.M. **P<0.005 versus vector alone. Tumor weights were measured at 21 days after viral injection. Scale bar: 10 mm. (e) Representative tumor image of mice models were stained with hematoxylin and eosin (H&E, top). Proliferative cells were assessed by staining with an anti-PCNA antibody. Arrows indicate the PCNA-positive stained cells (middle). The expression level of p85 was stained with anti-p85 antibody. Arrows indicate p85-positive stained cells (bottom). Scale bar: 20 μm

