Figure 5.
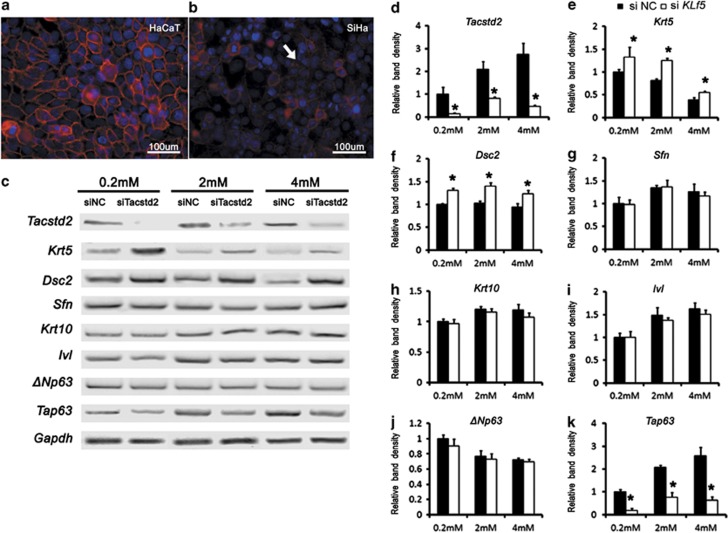
Effects of TACSTD2 on keratinocyte differentiation. (a and b) Immunofluorescent staining of TACSTD2 (red) and nuclear counterstaining of DAPI (blue) on HaCaT and Siha cells. Arrow indicated Siha cell membrane lack of cytomembrane staining of TACSTD2. (c–k) RT-PCR was used to quantitate Krt5, Dsc2, Krt10, Sfn, Ivl, TAp63, ΔNp63 and Gapdh mRNAs in control and Tacstd2-silenced HaCaT cells cultured in mediums with different calcium concentrations. Relative mRNA levels are shown as mean±S.E.M. compared by a two-tailed Student's t-test (*P<0.05, N=3). Two Tacstd2 siRNA oligos as described in Materials and methods section were tested, and similar phenotypes were observed. Higher efficiency of Tacstd2 knockdown was observed using Tacstd2 siRNA oligo (ID HSS106222), and a representative illustration is shown

