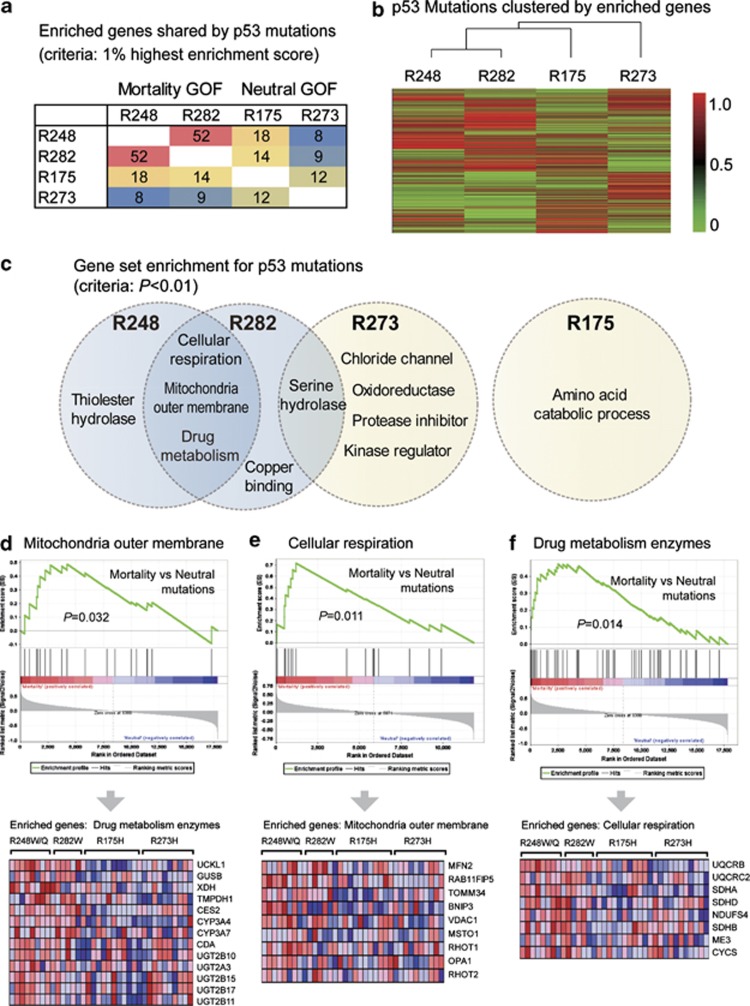
Figure 4.
Characteristic pathways of mortality-associated p53 mutations. (a) The number of enriched genes shared by different mutations. The colorectal cancer cases in TCGA were grouped according to p53 mutations, and Gene Set Enrichment Analysis (GSEA) was performed to identify upregulated genes/pathways for each mutation. The genes ranked as top 1% by enrichment scores were regarded as enriched genes (n=177), and the numbers of commonly enriched genes between the two mutations are shown. The mortality-associated mutations R248W and R282W shared 52 enriched genes, but such similarity is not found between other mutations. (b) Mutations are clustered according to their enrichment scores for each gene (enrichment profiles). Mortality-associated mutations show similar gene enrichment profiles and are clustered into one subgroup. (c) Enriched gene sets for different p53 mutations. Mortality-associated mutations (on R248 and R282 positions) shared the following enriched gene sets: (1) Mitochondrial outer membrane; (2) Cellular respiration; (3) Drug metabolism enzymes. Low similarity was found between other mutations. (d) GSEA plot (upper panel) and the expression of genes in the set ‘mitochondria outer membrane' (lower panel). (e) GSEA plot and gene expression in the pathway ‘cellular respiration'. (f) GSEA plot and expression of ‘drug metabolism enzymes' gene set

