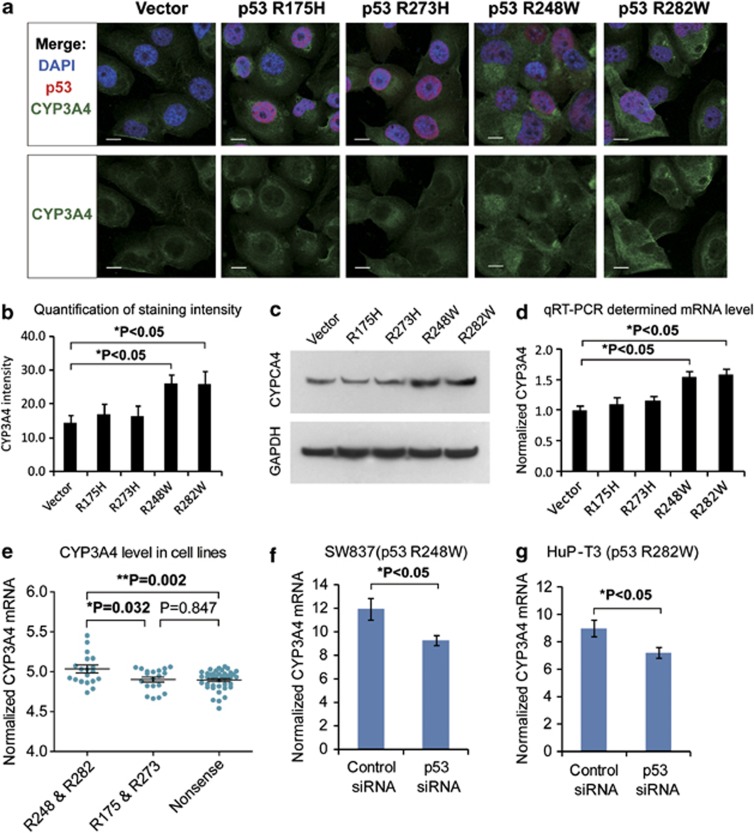
Figure 5.
Effects of p53 mutations on CYP3A4 expression. (a) Different p53 mutations were ectopically expressed in human H1299 cells (p53-null), and immunofluorescence was used to detect p53 (in red) and CYP3A4 (green). Cell nuclei were stained by DAPI in blue. Scale bars indicate 10 μm. (b) Statistical analysis of CYP3A4 fluorescence in cells expressing different p53 mutants. Data represent means±S.D. of four biological repeats. (c) Western Blot showing the level of CYP3A4 in H1299 cells expressing the indicated p53 mutants. Higher level of CYP3A4 protein expression was found in cells expressing p53 R248W and R282W mutations. (d) Quantitative RT-PCR detection of CYP3A4 mRNA expression in cells stably expressing different p53 mutations as indicated (data represent means±S.D., P<0.05, two-sided t-test). (e) CYP3A4 expression in cancer cells bearing different p53 mutations. The expression level of CYP3A4 was extracted using microarray data of Cancer Cell line Encyclopedia (CCLE) database. Then, the level of CYP3A4 was compared between cell bearing p53 mortality-associated mutations (on R248 or R282) or other mutations (on R175 R273) using Mann–Whitney test (P-value indicated). (f) The mRNA level of CYP3A4 in SW837 cells (bearing p53 mutation R248W) was measured by qRT-PCR. The CYP3A4 expression level decreased after mutant p53 was knocked down using specific siRNAs against p53 (data represent means±S.D., P<0.05, two-sided t-test). (g) The CYP3A4 expression level in HuP-T3 cells (carrying p53 mutation R282W) was determined by qRT-PCR. After p53 was suppressed by specific siRNAs, the CYP3A4 expression level also decreased (data represent means±S.D., P<0.05, two-sided t-test)

