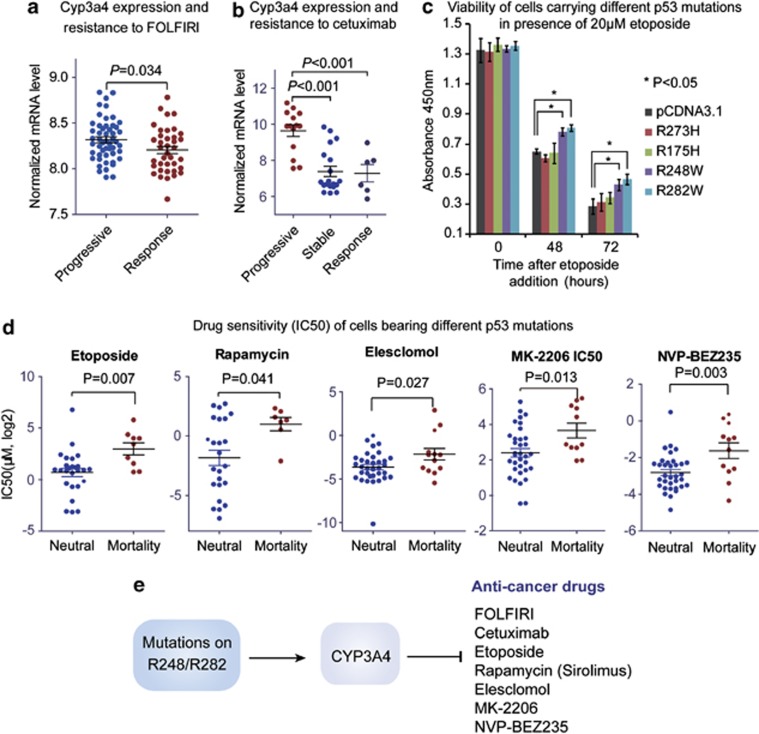
Figure 6.
Mutant p53 confer chemoresistance by upregulating CYP3A4. (a) CYP3A4 is upregulated in CRC cases showing resistance to FOLFIRI regimen. The mRNA expression level of CYP3A4 was extracted from microarray data (GEO data set GSE13294), and subsequently compared between FOLFIRI-response cases and progressive cases using Mann–Whitney test (P-value indicated). (b) CYP3A4 is upregulated in CRC cases showing resistance to cetuximab. The mRNA expression level of CYP3A4 was obtained from microarray data (GEO data set GSE5851), and then compared between cetuximab-response, stable and progressive CRC cases using Mann–Whitney test (P-value indicated). (c) The effects of different p53 mutations on cell response to etoposide were determined by CCK-8 viability assay. The H1299 cells stably expressing p53 mutants were incubated with 20 μM etoposide, and cell viability was determined by CCK-8 assay. The x-axis indicates the time after etoposide addition, while the y-axis shows the readout of CCK-8 (absorbance at 450nm). Data represent mean± S.D. (*P<0.05, two-sided t-test). (d) Cancer cells bearing p53 mortality-associated mutations display resistance to multiple drugs metabolized by CYP3A4. The IC50 data for different drugs were obtained from CCLE data set and compared between cell lines carrying p53 mortality-associated mutations and other mutations (on R175 and R273) using Mann–Whitney test (P-value indicated). (e) Schematic diagram showing the proposed model for mortality-associated p53 mutations. The p53 GOF mutations on R248 and R282 induce the upregulation of CYP3A4, which in turn metabolizes most chemotherapeutic drugs

