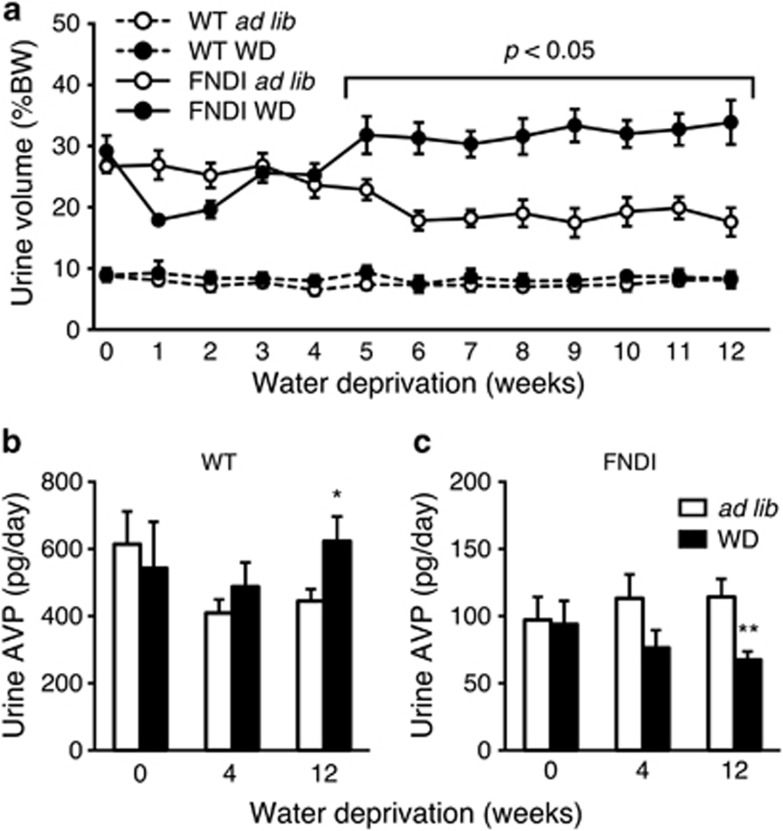
Figure 1.
Changes in urine volume and AVP. (a) Urine volumes in WT (dashed line) and FNDI mice (solid line) with water access ad libitum (ad lib, open circles) or subjected to WD (closed circles). (b and c) Urine AVP in ad lib and WD groups in WT (b) and FNDI mice (c). Results are expressed as means±S.E. *P<0.05, **P<0.01 compared with ad lib group at each corresponding time point. n=5–6 animals per group. % BW, percent body weight

