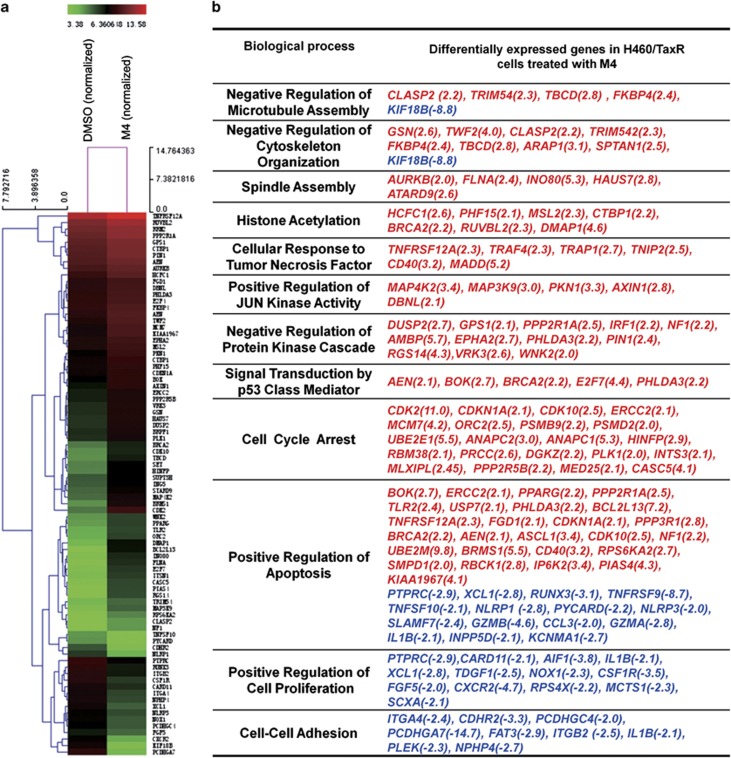
Figure 3.
Micrarray analysis of gene expression changes in H460/TaxR cells treated with M4 for 4 h. (a) The heat map shows the effect of M4 on the representative gene expression in H460/TaxR cells involved in the synergistic anticancer activity of M4. (b) Representation of differentially expressed gene involved in crucial pathways in cells treated with M4, red-genes upregulated, blue-genes downregulated. The number in the bracket is the fold change of the gene expression

