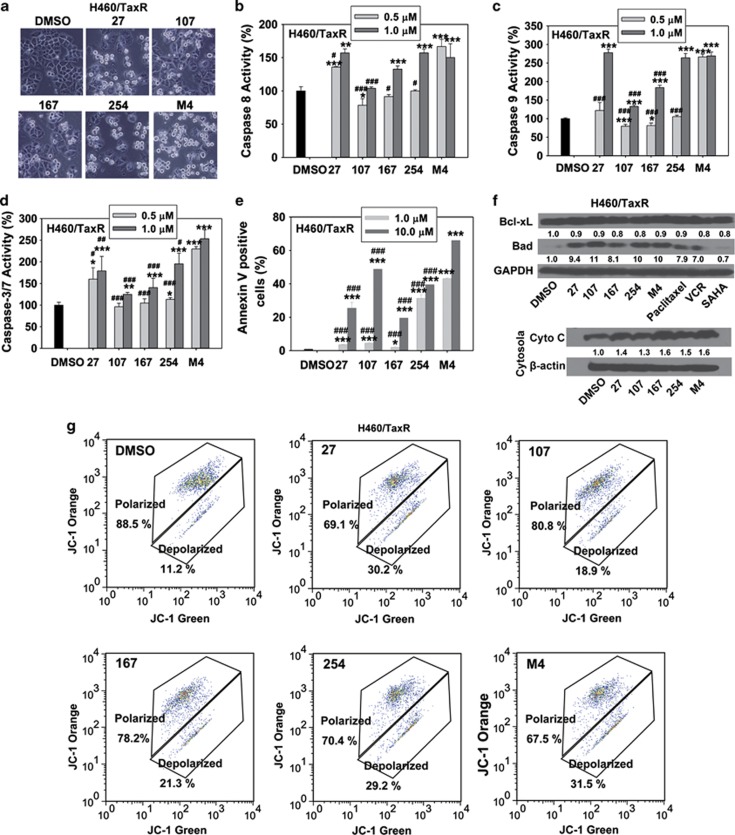
Figure 6.
Cell apoptosis analysis on the human lung caner cell H460/TaxR treated with compound alone or M4 for 24 h. (a) The morphology of cells treated with 1.0 μM individual compounds or M4. (b–d) Caspase-8, caspase-9 or caspase-3/7 activity in H460/TaxR cells treated with 0.5 or 1.0 μM individual compounds or M4 for 24 h. Cells were treated for 24 h in 96-well plate, and the caspase substrates were added to each well. Samples were read using a Victor2 multilabel counter (PerkinElmer) to detect the light produced through the luciferase reaction for caspase 8 or 9 activity or to detect the fluorescence at 485 nm (excitation)/535 nm (emission) for caspase3/7 activity. (e) The percentage of cells undergoing apoptosis after treatment with 1.0 and 10.0 μM individual compounds or M4 for 24 h. Cells were double stained with Annexin V and 7-AAD, and were analyzed by flow cytometry. The values presented are the means of three independent experiments±S.D. *, **, *** the value is significantly different from that of control (P<0.05, P<0.01, P<0.001, respectively); #, ##, ###the value is significantly different from that of M4 treatment at the same concentrations (P<0.05, P<0.01, P<0.001, respectively). (f) Cells were treated with individual compounds or M4 for 24 h, and the cell lysates were immunoblotted for the expression of apoptosis-related proteins. In addition, after treatment, the cells were harvested and separated into cytosolic and mitochondrial fractions, the expression of Cyt C in the cytosol were analyzed by western blot. (g) The disruption of mitochondrial membrane potential of individual compounds or M4 was measured by flow cytometry using the Guava EasyCyte MitoPotential kit

