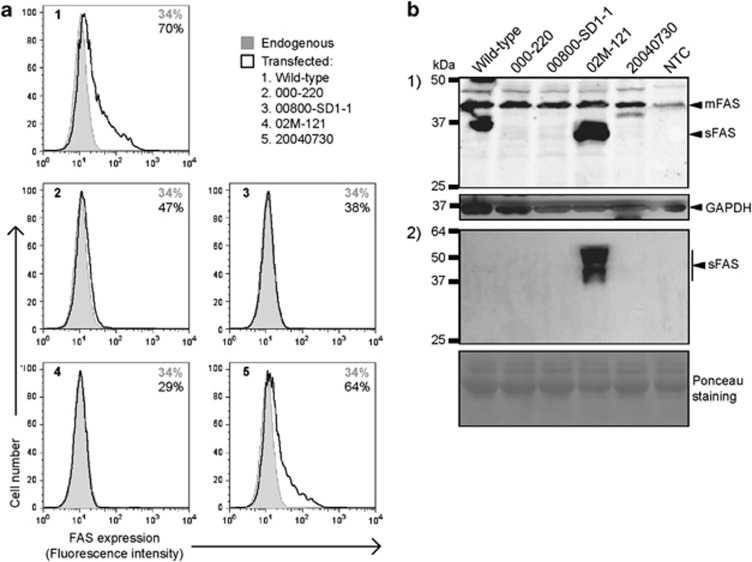
Figure 2.
In vitro expression levels of mutant FAS variants. (a) JK cells transfected with wild-type or mutant FAS variant pKEX constructs. Flow cytometry showing endogenous (shaded) and exogenous (solid) surface FAS expression levels 48 h after transfection. Figure shows a representative of three independent experiments. (b) HEK-293T cells transfected with wild-type or mutant FAS variant pKEX constructs. Western blot of (panel 1) cellular protein extracts and (panel 2) conditioned medium protein extracts. NTC, non-transfected control

