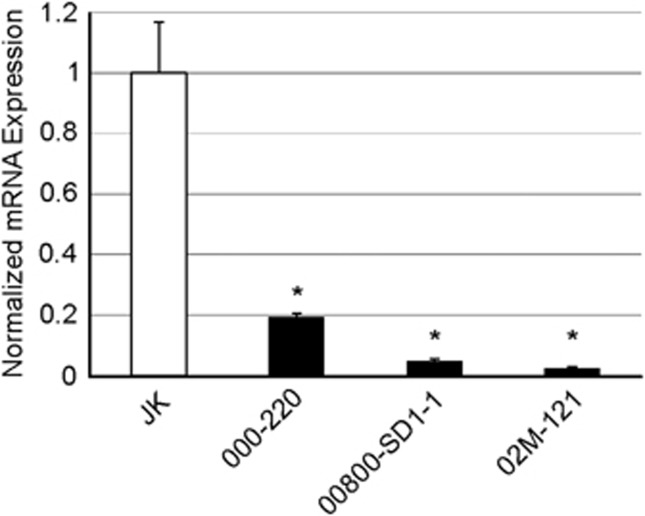
Figure 4.
FAS mRNA expression level in RNA samples. qRT-PCR determining FAS mRNA expression levels in human T-LBL samples where only RNA was available. The mean values were normalized to that of JK. Error bars represent S.D. Data represent two independent experiments. *Denotes statistical significance compared with the JK control, with P<0.05

