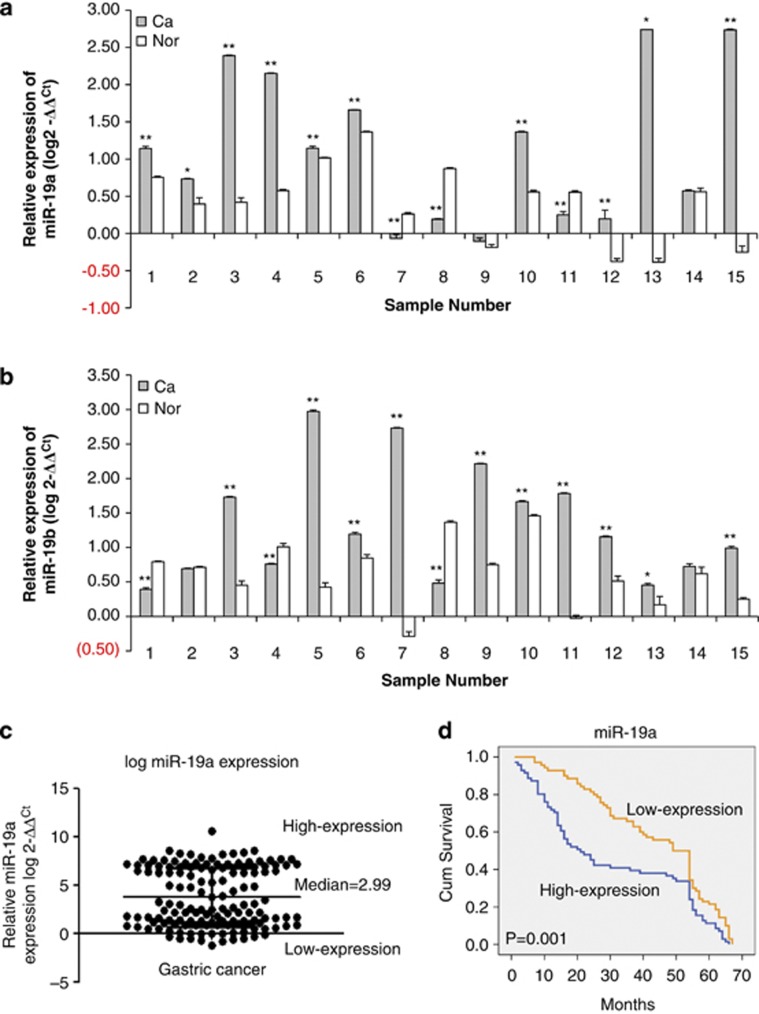
Figure 1.
Expression of miR-19a/b in gastric cancer tissues and their association with clinicopathologic characteristics. (a and b) Real-time PCR shows the expression of miR-19a (a) and miR-19b (b) in 15 randomly selected gastric cancer samples compared with the adjacent normal tissues (**P≤0.01, *P≤0.05). Each experiment was independently repeated at least three times. Error bars correspond to the mean±S.D. (c) Gastric cancer samples were divided into two groups, according to the median expression of miR-19a (median=2.99). Cases with levels of miR-19a below the mean were considered miR-19a low expressers (n=70), and those with levels of miR-19a above the mean were considered miR-19a high expressers (n=70). (d) Kaplan–Meier survival curve and log-rank test for gastric cancer patients between high and low miR-19a expressers to evaluate the relationship with patient survival

