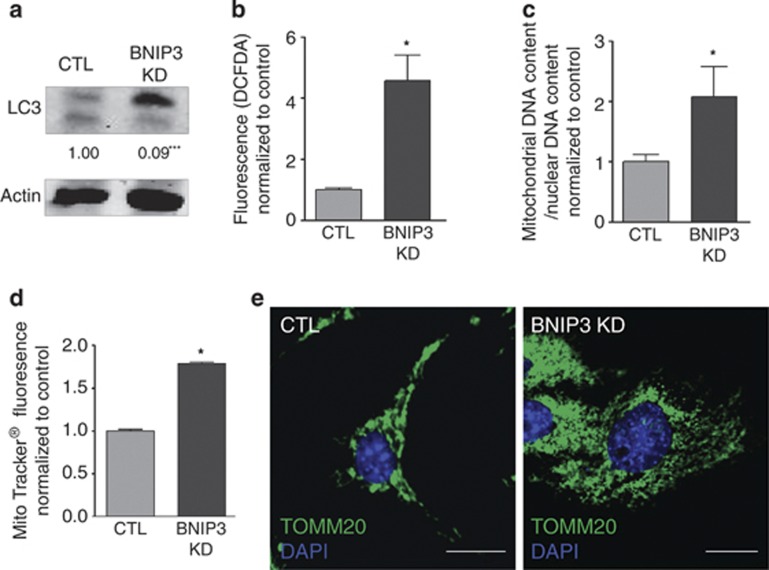
Figure 2.
BNIP3 modulates autophagic degradation of mitochondria and ROS signaling in melanoma. (a) The effect of BNIP3 KD on basal cellular LC3I to LC3II conversion in B16-F10 cells was determined by western blot (24 h after cell plating). A representative western blot (n=7) probed with anti-LC3 antibody of control and BNIP3 KD conditions and quantifications are shown. Actin is used as a loading control. (b) Assessment of the effect of BNIP3 KD on cellular ROS levels in B16-F10 cells (24 h after cell plating). Cellular fluorescence (green) is shown for control and BNIP3 KD conditions after incubation of the cells with CM-H2DCFDA (10 μM) for 30 min (n=6). (c) Analysis of the mitochondrial DNA content of control and BNIP3 KD B16-F10 cells assessed as the ratio of mitochondrial (LPL)/ nuclear (ND1) DNA copy numbers (n=5). (d) Assessment of the effect of BNIP3 KD on cellular Mitotracker uptake in B16-F10 cells (24 h after cell plating). Cellular fluorescence (deep red) is shown for control and BNIP3 KD conditions after incubation of the cells with Mitotracker (25 nM) for 30 min (n=3) and (e) representative confocal images (n=3, five pictures per condition) of control and BNIP3 KD B16-F10 cells (24 h after cell plating), after immunostaining for TOMM20 and the nuclear dye DAPI, scale bars represent 10 μM

