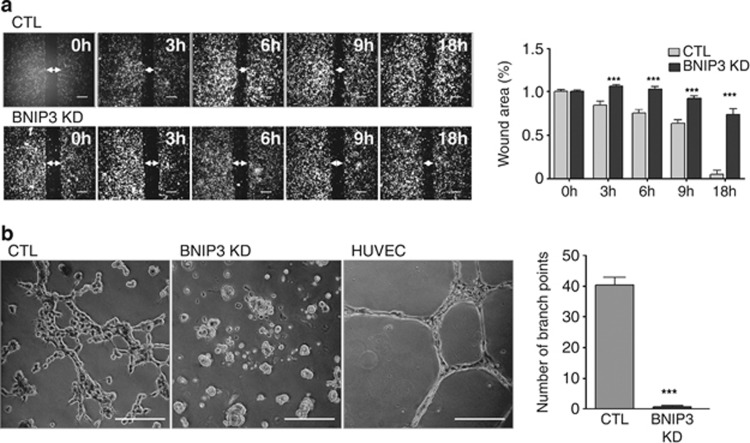
Figure 3.
BNIP3 promotes melanoma cell migration and VM. (a) Two-dimensional cell migration of control versus BNIP3 KD B16-F10 cells. Representative images (n=3) of the scratch at indicated time points and quantification of the wound area (size wound at Tx/size wound at T0) are shown, arrows indicate the wound area, scale bars represent 400 μm. (b) The ability of the B16-F10 cells to form a vascular-like network was assessed by plating the cells on growth factor reduced Matrigel. Representative images (n=4) 16 h after cell seeding and quantification are shown of control and BNIP3 KD cells, HUVEC were used as a positive control, scale bars represent 200 μm

