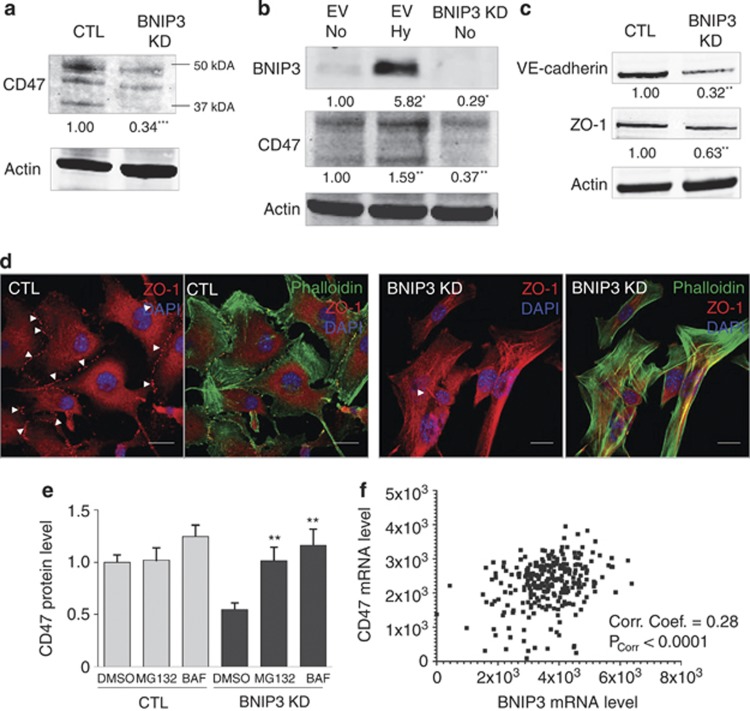
Figure 7.
BNIP3 KD reduces the protein levels of CD47, associated with reduced cell–cell interaction. (a) Analysis of the effect of BNIP3 KD B16-F10 cells on CD47 protein level (24 h after cell plating). A representative western blot (n=6) probed with anti-CD47 antibody of control and BNIP3 KD cells is shown. Actin is used as a loading control. (b) Analysis of the effect of hypoxia (1.5%O2-24 h)-induced BNIP3 on CD47 protein level as compared with BNIP3 KD (24 h after cell plating). A representative western blot (n=3) probed with anti-CD47 antibody of EV normoxia, EV hypoxia and BNIP3 KD B16-F10 cells (normoxia) is shown, actin is used to verify equal loading. Note that the baseline levels of BNIP3 in this western blot are almost not visible due to lower exposure chosen to avoid overexposure of the signal of the hypoxia-mediated BNIP3 induction. (c) Immunoblotting for the adherens junction protein VE–cadherin and the tight junction protein ZO-1 (24 h after cell plating) of B16-F10 cells, actin is used to verify equal loading (n=3). (d) Confocal microscopy analysis after immunostaining for ZO-1 to reveal tight junctions and Phalloidin-Alexa 488 to document cellular orientation combined with the nuclear dye DAPI of B16-F10 cells (24 h after cell plating). Representative pictures (n=3) of control and BNIP3 KD cells are shown, scale bar represents 10 μM. (e) Effect of proteasome inhibition via MG132 10 μM-3 h (MG132) or inhibition of lysosomal degradation via Bafilomycin A1 10 nM-3 h (BAF) on CD47 protein levels in control and BNIP3 KD B16-F10 cells. Quantification of immunoblots (n=4) probed with anti-CD47 antibody of control and BNIP3 KD cells treated with DMSO, LAC and BAF (relative to DMSO-treated control conditions) are shown, actin is used to verify equal loading. (f) A scatterplot of correlation between CD47 transcript expression levels and BNIP3 transcript expression levels in a cohort of skin cutaneous melanoma patients (n=312). Correlation levels have been estimated on the basis of correlation coefficient (Corr. Coef.) and the P-value for this correlation (PCorr), both of which are displayed on the plot. Here, a Corr. Coef.=1 represents a perfect correlation between the variables while Corr. Coef. between 0 and 1 denotes that the two variables tend to increase or decrease together

